29
/it/
it
AIzaSyAYiBZKx7MnpbEhh9jyipgxe19OcubqV5w
April 1, 2024
208429
Netherlands
NLD
true
2
1
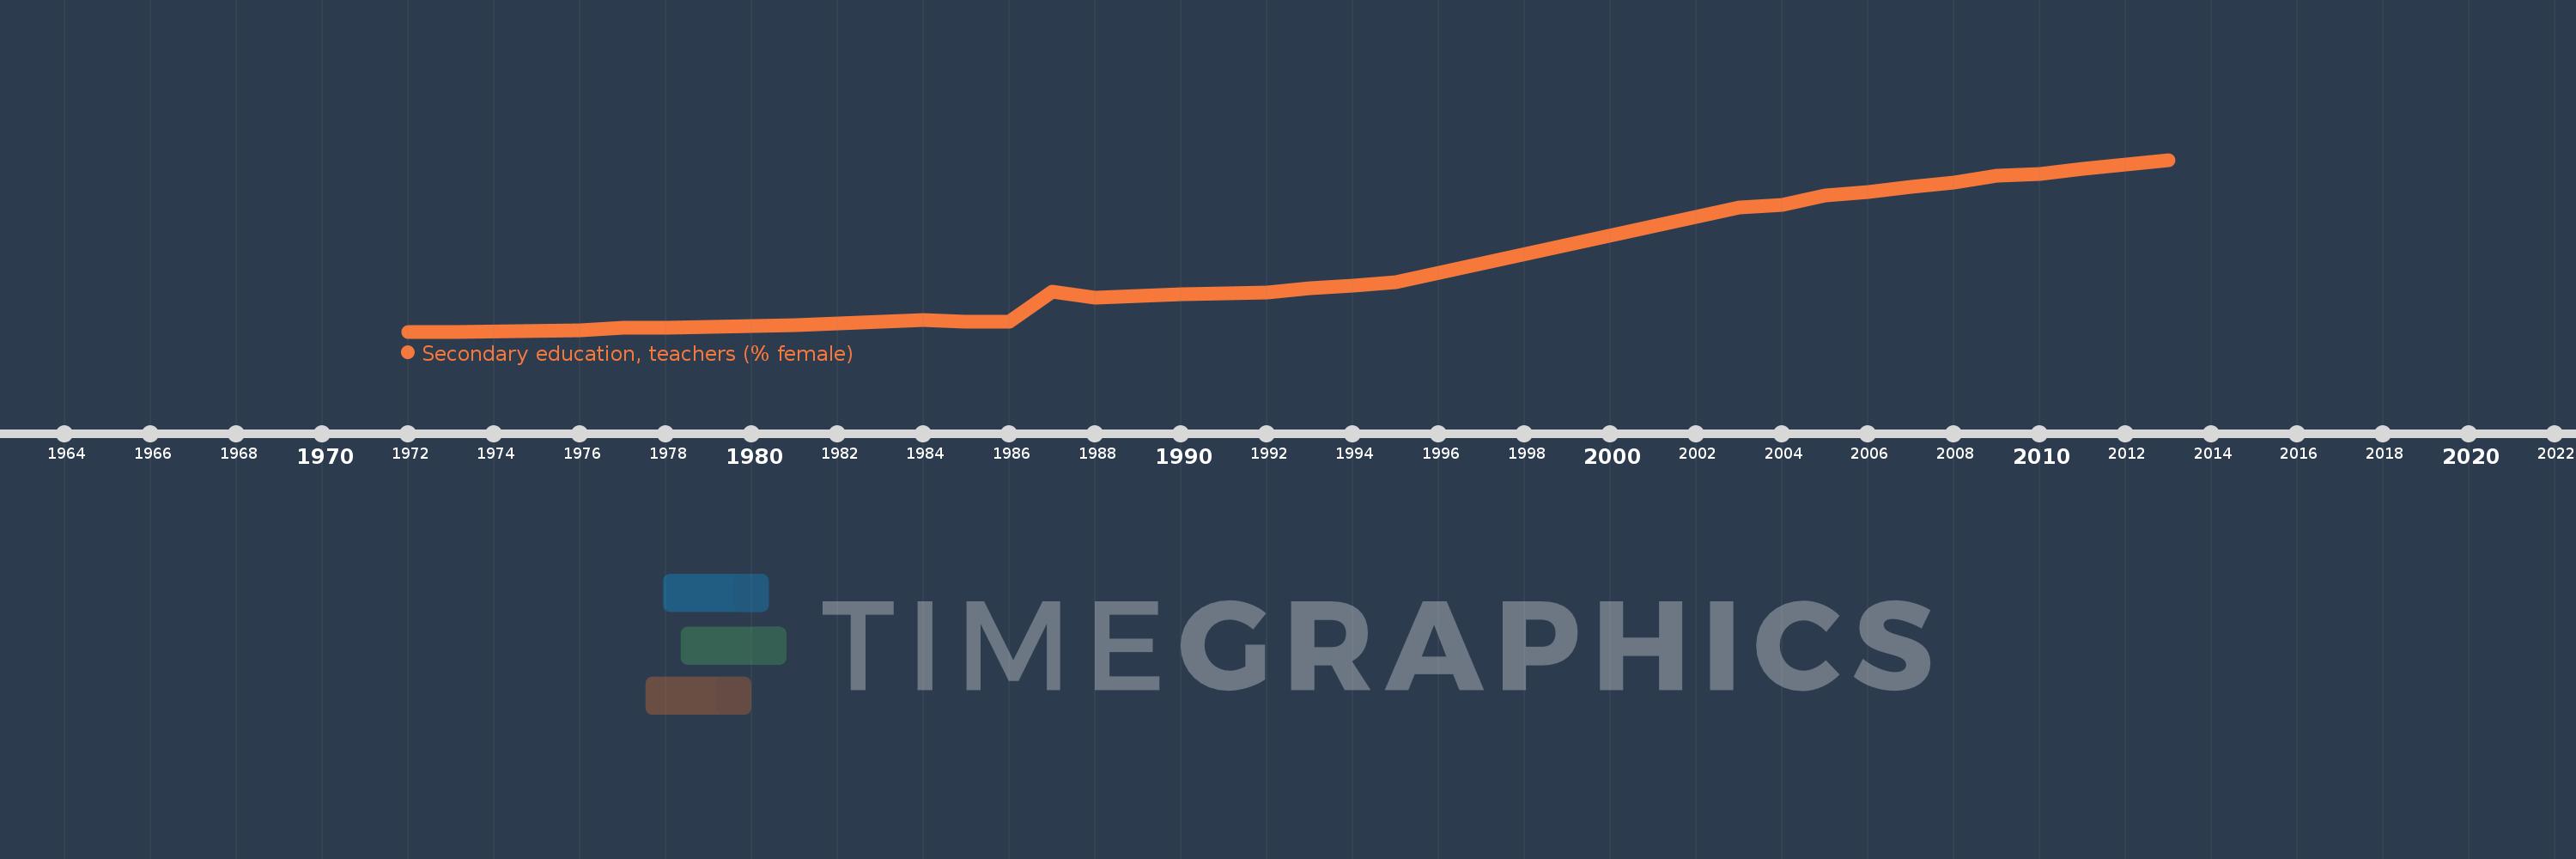
Secondary education, teachers (% female)
2013,2012,2011,2010,2009,2008,2007,2006,2005,2004,2003,1995,1994,1993,1992,1991,1990,1989,1988,1987,1986,1985,1984,1983,1981,1980,1979,1978,1977,1976,1973,1972
Queste statistiche in altri paesi:
AfghanistanAlbaniaAlgeriaAndorraAngolaAntigua and BarbudaArab WorldArgentinaArmeniaArubaAustraliaAustriaBahamas, TheBahrainBangladeshBarbadosBelarusBelgiumBelizeBeninBermudaBhutanBoliviaBosnia and HerzegovinaBotswanaBrazilBritish Virgin IslandsBrunei DarussalamBulgariaBurkina FasoBurundiCabo VerdeCambodiaCameroonCanadaCaribbean small statesCayman IslandsCentral African RepublicCentral Europe and the BalticsChadChileChinaColombiaComorosCongo, Dem. Rep.Congo, Rep.Costa RicaCote d'IvoireCroatiaCubaCyprusCzech RepublicDenmarkDjiboutiDominicaDominican RepublicEarly-demographic dividendEast Asia & PacificEast Asia & Pacific (excluding high income)East Asia & Pacific (IDA & IBRD countries)EcuadorEgypt, Arab Rep.El SalvadorEquatorial GuineaEritreaEstoniaEthiopiaEuro areaEurope & Central AsiaEurope & Central Asia (excluding high income)Europe & Central Asia (IDA & IBRD countries)European UnionFijiFinlandFragile and conflict affected situationsFranceGabonGambia, TheGeorgiaGermanyGhanaGibraltarGreeceGrenadaGuatemalaGuineaGuinea-BissauGuyanaHeavily indebted poor countries (HIPC)High incomeHondurasHong Kong SAR, ChinaHungaryIBRD onlyIcelandIDA & IBRD totalIDA blendIDA onlyIDA totalIndiaIndonesiaIran, Islamic Rep.IraqIrelandIsraelItalyJamaicaJapanJordanKazakhstanKenyaKiribatiKorea, Dem. People’s Rep.Korea, Rep.KuwaitKyrgyz RepublicLao PDRLate-demographic dividendLatin America & Caribbean Latin America & Caribbean (excluding high income)Latin America & the Caribbean (IDA & IBRD countries)LatviaLeast developed countries: UN classificationLebanonLesothoLiberiaLibyaLiechtensteinLithuaniaLow & middle incomeLow incomeLower middle incomeLuxembourgMacao SAR, ChinaMacedonia, FYRMadagascarMalawiMalaysiaMaldivesMaliMaltaMarshall IslandsMauritaniaMauritiusMexicoMiddle East & North AfricaMiddle East & North Africa (excluding high income)Middle East & North Africa (IDA & IBRD countries)Middle incomeMoldovaMonacoMongoliaMoroccoMozambiqueMyanmarNamibiaNauruNepalNetherlandsNew ZealandNicaraguaNigerNigeriaNorth AmericaNorwayOECD membersOmanOther small statesPacific island small statesPakistanPalauPanamaPapua New GuineaParaguayPeruPhilippinesPolandPortugalPost-demographic dividendPre-demographic dividendPuerto RicoQatarRomaniaRussian FederationRwandaSamoaSan MarinoSao Tome and PrincipeSaudi ArabiaSenegalSerbiaSeychellesSierra LeoneSingaporeSint Maarten (Dutch part)Slovak RepublicSloveniaSmall statesSolomon IslandsSomaliaSouth AfricaSouth AsiaSouth Asia (IDA & IBRD)SpainSri LankaSt. Kitts and NevisSt. LuciaSt. Vincent and the GrenadinesSub-Saharan Africa Sub-Saharan Africa (excluding high income)Sub-Saharan Africa (IDA & IBRD countries)SudanSurinameSwazilandSwedenSwitzerlandSyrian Arab RepublicTajikistanTanzaniaThailandTimor-LesteTogoTongaTrinidad and TobagoTunisiaTurkeyTurks and Caicos IslandsUgandaUkraineUnited Arab EmiratesUnited KingdomUnited StatesUpper middle incomeUruguayUzbekistanVanuatuVenezuela, RBVietnamWest Bank and GazaWorldYemen, Rep.ZambiaZimbabwe Linea del tempo:
Questa scala temporale mostra un grafico dal 1972 anno al 2013 anno. Netherlands. I dati fino ad 1971 anno non disponibili. Il numero di osservazioni attuali secondo i date: 32.
La fonte (nome):
Indicatori dello sviluppo mondiale
La fonte (organizzazione):
United Nations Educational, Scientific, and Cultural Organization (UNESCO) Institute for Statistics.
Categorie:
Education, Gender
sono stati aggiornati
23 apr 2017 anni
Indicatori delle variazioni dei valori per anni
Minima:
22.8
1 gen 1972 anni
Massimo:
49.919
1 gen 2013 anni
Alla data di osservazione
Valore
Variazione assoluta
La variazione rispetto al valore precedente
1 gen 1972 anni
22.8
+22.8
0.0%
1 gen 1973 anni
22.8
+0.0
0.0%
1 gen 1976 anni
22.98
+0.18
0.79%
1 gen 1977 anni
23.354
+0.374
1.63%
1 gen 1978 anni
23.343
-0.012
-0.05%
1 gen 1979 anni
23.597
+0.254
1.09%
1 gen 1980 anni
23.713
+0.116
0.49%
1 gen 1981 anni
23.813
+0.1
0.42%
1 gen 1983 anni
24.299
+0.485
2.04%
1 gen 1984 anni
24.575
+0.277
1.14%
1 gen 1985 anni
24.417
-0.158
-0.64%
1 gen 1986 anni
24.314
-0.103
-0.42%
1 gen 1987 anni
29.051
+4.736
19.48%
1 gen 1988 anni
28.2
-0.85
-2.93%
1 gen 1989 anni
28.394
+0.194
0.69%
1 gen 1990 anni
28.693
+0.299
1.05%
1 gen 1991 anni
28.838
+0.145
0.5%
1 gen 1992 anni
28.981
+0.143
0.49%
1 gen 1993 anni
29.587
+0.607
2.09%
1 gen 1994 anni
30.0
+0.413
1.4%
1 gen 1995 anni
30.614
+0.614
2.05%
1 gen 2003 anni
42.388
+11.775
38.46%
1 gen 2004 anni
42.781
+0.392
0.93%
1 gen 2005 anni
44.281
+1.5
3.51%
1 gen 2006 anni
44.837
+0.556
1.25%
1 gen 2007 anni
45.602
+0.765
1.71%
1 gen 2008 anni
46.379
+0.777
1.7%
1 gen 2009 anni
47.373
+0.994
2.14%
1 gen 2010 anni
47.687
+0.314
0.66%
1 gen 2011 anni
48.552
+0.865
1.81%
1 gen 2012 anni
49.163
+0.611
1.26%
1 gen 2013 anni
49.919
+0.756
1.54%
Classificazione dei paesi secondo i statistiche attuali per anni


Commenti: