29
/it/
it
AIzaSyAYiBZKx7MnpbEhh9jyipgxe19OcubqV5w
April 1, 2024
36883
IBRD only
IBD
false
2
1
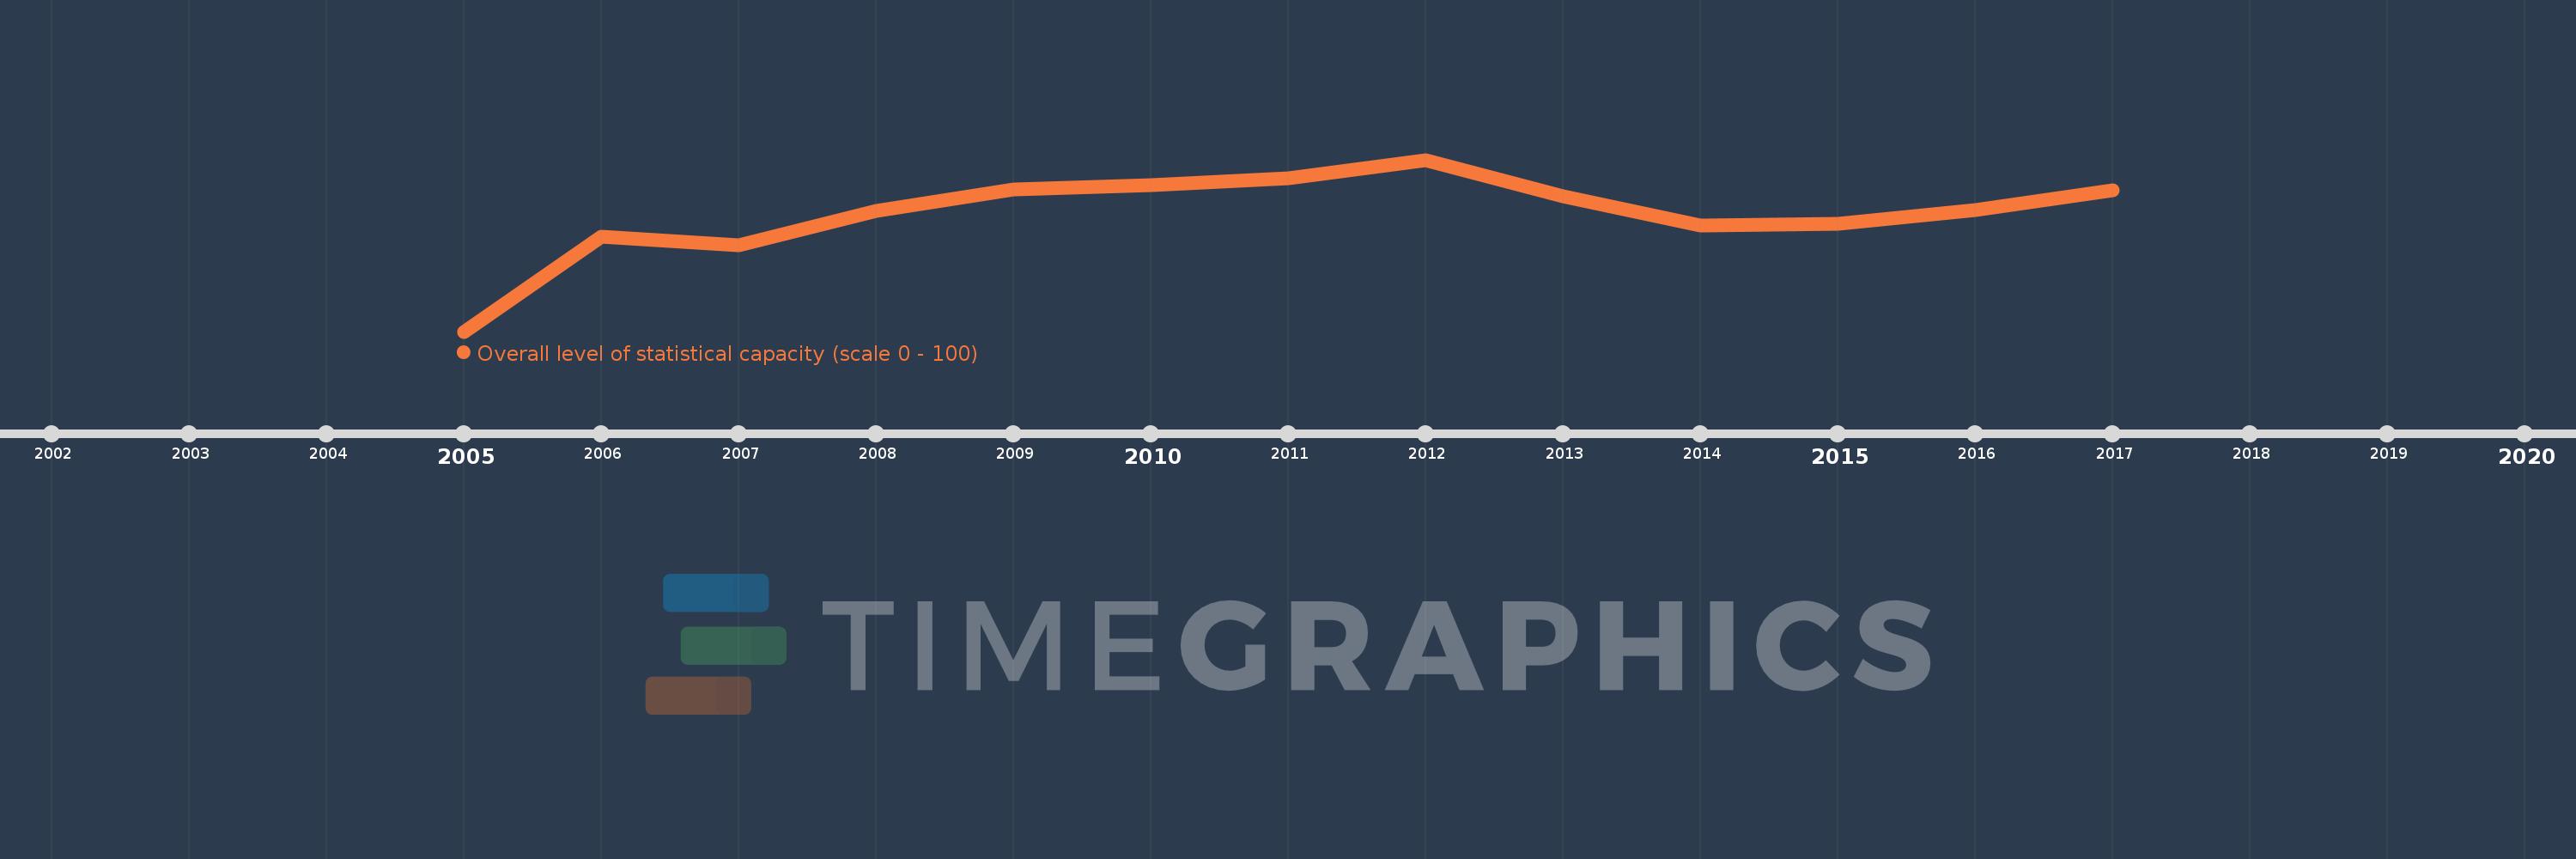
Overall level of statistical capacity (scale 0 - 100)
2017,2016,2015,2014,2013,2012,2011,2010,2009,2008,2007,2006,2005
Queste statistiche in altri paesi:
Linea del tempo:
Questa scala temporale mostra un grafico dal 2005 anno al 2017 anno. IBRD only. I dati fino ad 2004 anno non disponibili. Il numero di osservazioni attuali secondo i date: 13.
La fonte (nome):
Indicatori dello sviluppo mondiale
La fonte (organizzazione):
World Bank
Categorie:
Public Sector
sono stati aggiornati
23 apr 2017 anni
Indicatori delle variazioni dei valori per anni
Minima:
72.778
1 gen 2005 anni
Massimo:
76.647
1 gen 2012 anni
Alla data di osservazione
Valore
Variazione assoluta
La variazione rispetto al valore precedente
1 gen 2005 anni
72.778
+72.778
0.0%
1 gen 2006 anni
74.921
+2.143
2.94%
1 gen 2007 anni
74.722
-0.198
-0.26%
1 gen 2008 anni
75.496
+0.774
1.04%
1 gen 2009 anni
75.972
+0.476
0.63%
1 gen 2010 anni
76.071
+0.099
0.13%
1 gen 2011 anni
76.24
+0.169
0.22%
1 gen 2012 anni
76.647
+0.407
0.53%
1 gen 2013 anni
75.833
-0.813
-1.06%
1 gen 2014 anni
75.159
-0.675
-0.89%
1 gen 2015 anni
75.2
+0.042
0.06%
1 gen 2016 anni
75.516
+0.315
0.42%
1 gen 2017 anni
75.952
+0.437
0.58%
Classificazione dei paesi secondo i statistiche attuali per anni


Commenti: