29
/it/
it
AIzaSyAYiBZKx7MnpbEhh9jyipgxe19OcubqV5w
April 1, 2024
263866
Timor-Leste
TLS
true
2
1
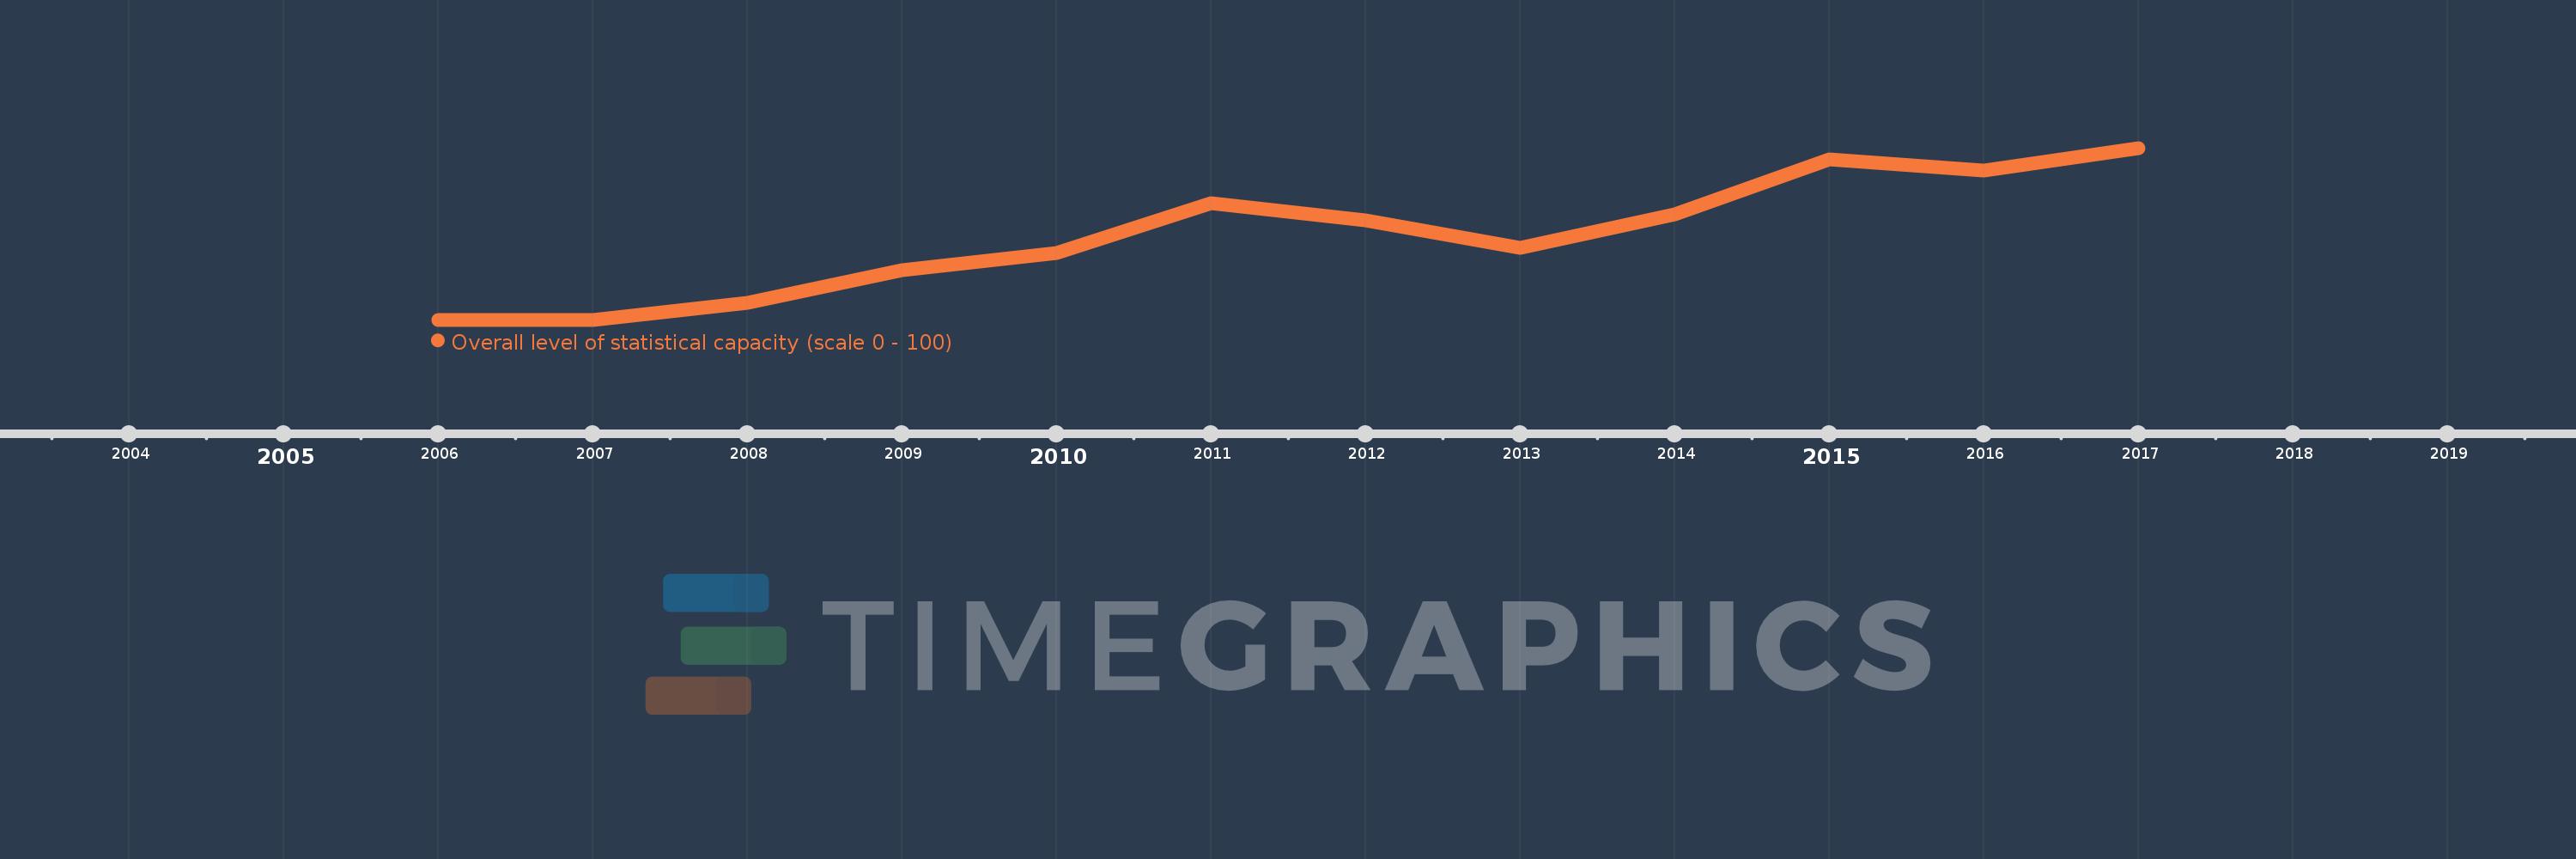
Overall level of statistical capacity (scale 0 - 100)
2017,2016,2015,2014,2013,2012,2011,2010,2009,2008,2007,2006
Queste statistiche in altri paesi:
Linea del tempo:
Questa scala temporale mostra un grafico dal 2006 anno al 2017 anno. Timor-Leste. I dati fino ad 2005 anno non disponibili. Il numero di osservazioni attuali secondo i date: 12.
La fonte (nome):
Indicatori dello sviluppo mondiale
La fonte (organizzazione):
World Bank
Categorie:
Public Sector
sono stati aggiornati
23 apr 2017 anni
Indicatori delle variazioni dei valori per anni
Minima:
32.222
1 gen 2006 anni
Massimo:
66.667
1 gen 2017 anni
Alla data di osservazione
Valore
Variazione assoluta
La variazione rispetto al valore precedente
1 gen 2006 anni
32.222
+32.222
0.0%
1 gen 2007 anni
32.222
0.0
0.0%
1 gen 2008 anni
35.556
+3.333
10.34%
1 gen 2009 anni
42.222
+6.667
18.75%
1 gen 2010 anni
45.556
+3.333
7.89%
1 gen 2011 anni
55.556
+10.0
21.95%
1 gen 2012 anni
52.222
-3.333
-6.0%
1 gen 2013 anni
46.667
-5.556
-10.64%
1 gen 2014 anni
53.333
+6.667
14.29%
1 gen 2015 anni
64.444
+11.111
20.83%
1 gen 2016 anni
62.222
-2.222
-3.45%
1 gen 2017 anni
66.667
+4.444
7.14%
Classificazione dei paesi secondo i statistiche attuali per anni


Commenti: