29
/it/
it
AIzaSyAYiBZKx7MnpbEhh9jyipgxe19OcubqV5w
April 1, 2024
36055
High income
HIC
false
2
1
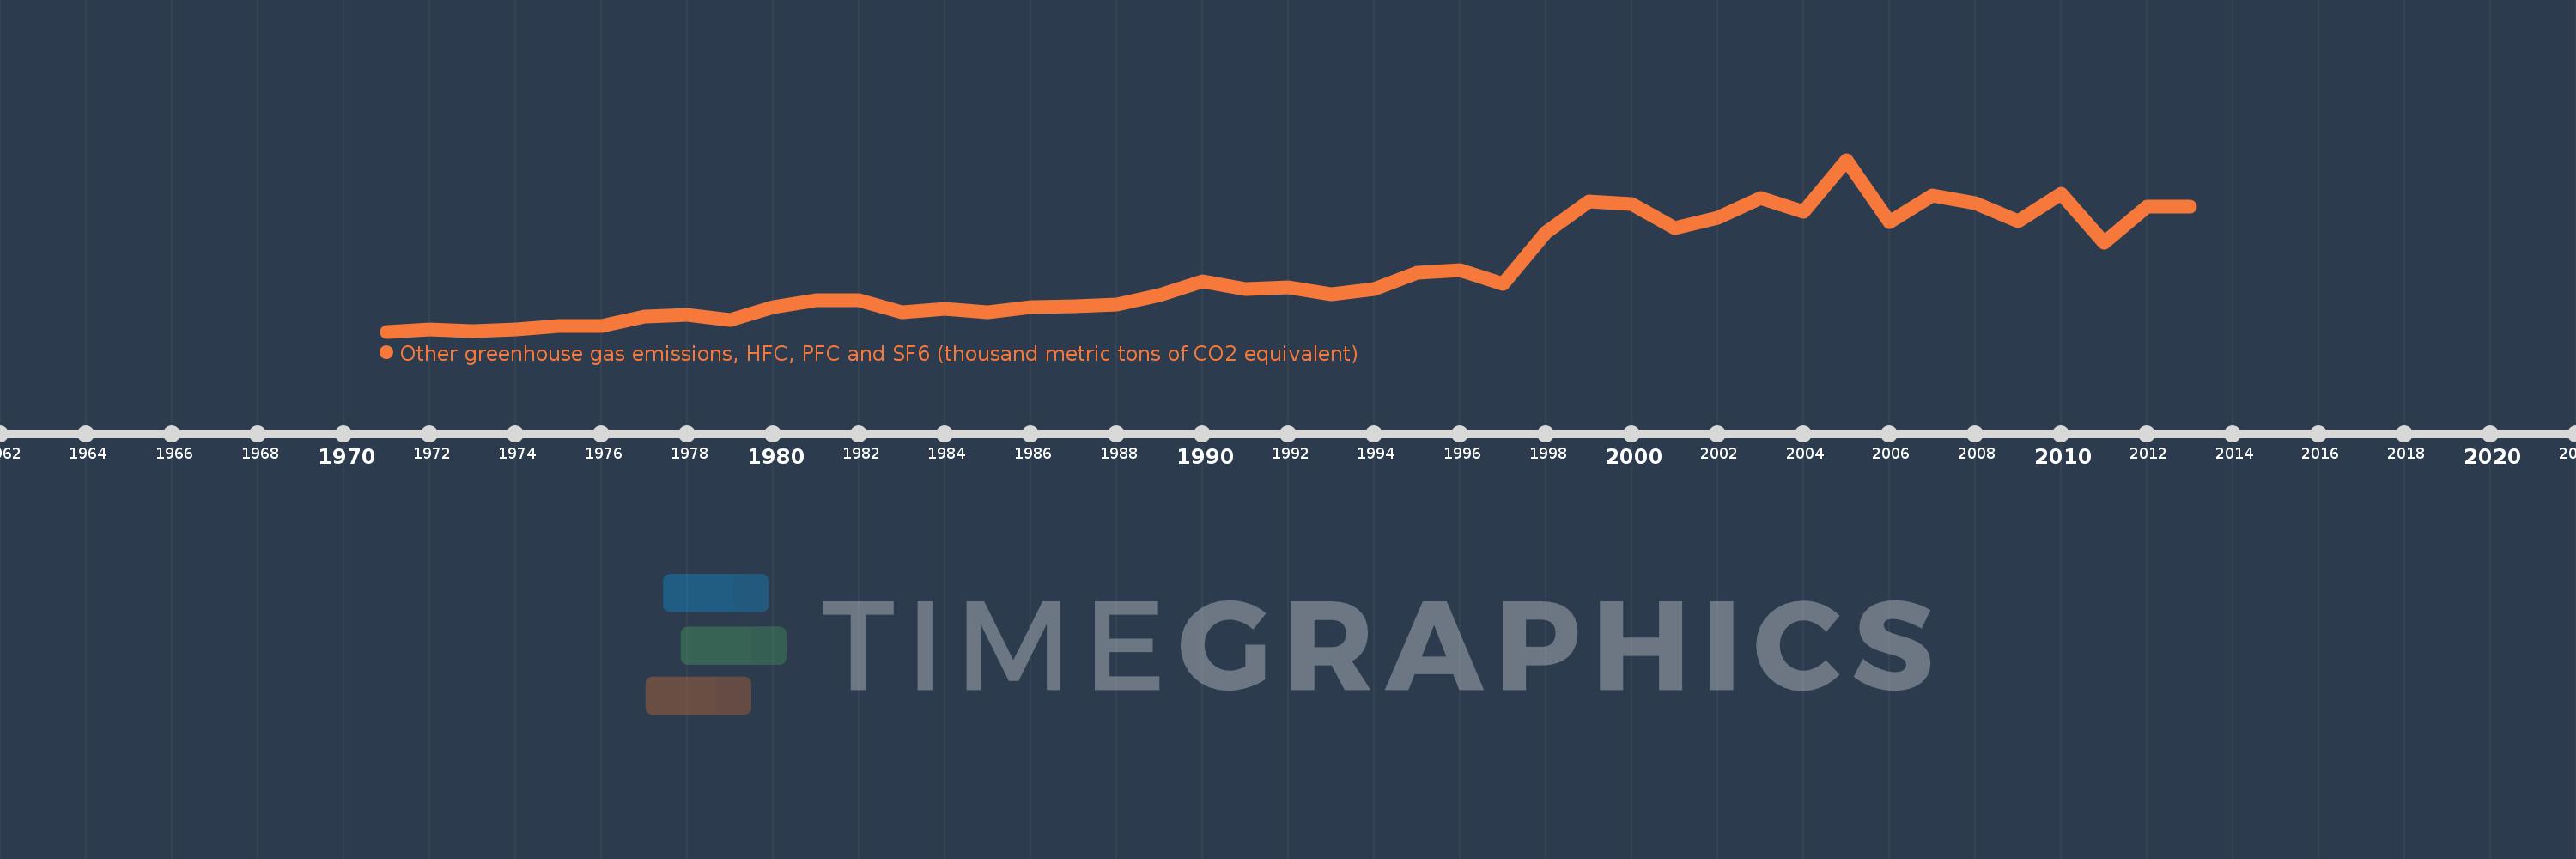
Other greenhouse gas emissions, HFC, PFC and SF6 (thousand metric tons of CO2 equivalent)
2013,2012,2011,2010,2009,2008,2007,2006,2005,2004,2003,2002,2001,2000,1999,1998,1997,1996,1995,1994,1993,1992,1991,1990,1989,1988,1987,1986,1985,1984,1983,1982,1981,1980,1979,1978,1977,1976,1975,1974,1973,1972,1971
Queste statistiche in altri paesi:
AfghanistanAlbaniaAlgeriaAmerican SamoaAngolaAntigua and BarbudaArab WorldArgentinaArmeniaArubaAustraliaAustriaAzerbaijanBahamas, TheBahrainBangladeshBarbadosBelarusBelgiumBelizeBeninBermudaBhutanBoliviaBosnia and HerzegovinaBotswanaBrazilBritish Virgin IslandsBrunei DarussalamBulgariaBurkina FasoBurundiCabo VerdeCambodiaCameroonCanadaCaribbean small statesCayman IslandsCentral African RepublicCentral Europe and the BalticsChadChileChinaColombiaComorosCongo, Dem. Rep.Congo, Rep.Costa RicaCote d'IvoireCroatiaCubaCyprusCzech RepublicDenmarkDjiboutiDominicaDominican RepublicEarly-demographic dividendEast Asia & PacificEast Asia & Pacific (excluding high income)East Asia & Pacific (IDA & IBRD countries)EcuadorEgypt, Arab Rep.El SalvadorEquatorial GuineaEritreaEstoniaEthiopiaEuro areaEurope & Central AsiaEurope & Central Asia (excluding high income)Europe & Central Asia (IDA & IBRD countries)European UnionFaroe IslandsFijiFinlandFragile and conflict affected situationsFranceFrench PolynesiaGabonGambia, TheGeorgiaGermanyGhanaGibraltarGreeceGreenlandGrenadaGuamGuatemalaGuineaGuinea-BissauGuyanaHaitiHeavily indebted poor countries (HIPC)High incomeHondurasHong Kong SAR, ChinaHungaryIBRD onlyIcelandIDA & IBRD totalIDA blendIDA onlyIDA totalIndiaIndonesiaIran, Islamic Rep.IraqIrelandIsraelItalyJamaicaJapanJordanKazakhstanKenyaKiribatiKorea, Dem. People’s Rep.Korea, Rep.KuwaitKyrgyz RepublicLao PDRLate-demographic dividendLatin America & Caribbean Latin America & Caribbean (excluding high income)Latin America & the Caribbean (IDA & IBRD countries)LatviaLeast developed countries: UN classificationLebanonLesothoLiberiaLibyaLithuaniaLow & middle incomeLow incomeLower middle incomeLuxembourgMacao SAR, ChinaMacedonia, FYRMadagascarMalawiMalaysiaMaldivesMaliMaltaMauritaniaMauritiusMexicoMiddle East & North AfricaMiddle East & North Africa (excluding high income)Middle East & North Africa (IDA & IBRD countries)Middle incomeMoldovaMongoliaMoroccoMozambiqueMyanmarNamibiaNauruNepalNetherlandsNew CaledoniaNew ZealandNicaraguaNigerNigeriaNorth AmericaNorwayOECD membersOmanOther small statesPacific island small statesPakistanPanamaPapua New GuineaParaguayPeruPhilippinesPolandPortugalPost-demographic dividendPre-demographic dividendPuerto RicoQatarRomaniaRussian FederationRwandaSamoaSao Tome and PrincipeSaudi ArabiaSenegalSeychellesSierra LeoneSingaporeSlovak RepublicSloveniaSmall statesSolomon IslandsSomaliaSouth AfricaSouth AsiaSouth Asia (IDA & IBRD)SpainSri LankaSt. Kitts and NevisSt. LuciaSt. Vincent and the GrenadinesSub-Saharan Africa Sub-Saharan Africa (excluding high income)Sub-Saharan Africa (IDA & IBRD countries)SudanSurinameSwazilandSwedenSwitzerlandSyrian Arab RepublicTajikistanTanzaniaThailandTimor-LesteTogoTongaTrinidad and TobagoTunisiaTurkeyTurkmenistanTurks and Caicos IslandsTuvaluUgandaUkraineUnited Arab EmiratesUnited KingdomUnited StatesUpper middle incomeUruguayUzbekistanVanuatuVenezuela, RBVietnamVirgin Islands (U.S.)WorldYemen, Rep.ZambiaZimbabwe Linea del tempo:
Questa scala temporale mostra un grafico dal 1971 anno al 2013 anno. High income. I dati fino ad 1970 anno non disponibili. Il numero di osservazioni attuali secondo i date: 43.
La fonte (nome):
Indicatori dello sviluppo mondiale
La fonte (organizzazione):
World Bank staff estimates from original source: European Commission, Joint Research Centre (JRC)/Netherlands Environmental Assessment Agency (PBL). Emission Database for Global Atmospheric Research (EDGAR): http://edgar.jrc.ec.europa.eu/.
Categorie:
Climate Change, Environment
sono stati aggiornati
23 apr 2017 anni
Indicatori delle variazioni dei valori per anni
Minima:
222.38 Mille.
1 gen 1971 anni
Massimo:
1.489 Mln
1 gen 2005 anni
Alla data di osservazione
Valore
Variazione assoluta
La variazione rispetto al valore precedente
1 gen 1971 anni
222.38 Mille.
+222.38 Mille.
0.0%
1 gen 1972 anni
237.827 Mille.
+15.447 Mille.
6.95%
1 gen 1973 anni
228.288 Mille.
-9.539 Mille.
-4.01%
1 gen 1974 anni
235.881 Mille.
+7.593 Mille.
3.33%
1 gen 1975 anni
261.504 Mille.
+25.623 Mille.
10.86%
1 gen 1976 anni
260.539 Mille.
-965.226
-0.37%
1 gen 1977 anni
332.526 Mille.
+71.987 Mille.
27.63%
1 gen 1978 anni
344.264 Mille.
+11.738 Mille.
3.53%
1 gen 1979 anni
310.966 Mille.
-33.298 Mille.
-9.67%
1 gen 1980 anni
404.743 Mille.
+93.777 Mille.
30.16%
1 gen 1981 anni
455.997 Mille.
+51.254 Mille.
12.66%
1 gen 1982 anni
451.154 Mille.
-4.843 Mille.
-1.06%
1 gen 1983 anni
365.123 Mille.
-86.03 Mille.
-19.07%
1 gen 1984 anni
393.319 Mille.
+28.196 Mille.
7.72%
1 gen 1985 anni
367.537 Mille.
-25.782 Mille.
-6.55%
1 gen 1986 anni
402.234 Mille.
+34.697 Mille.
9.44%
1 gen 1987 anni
408.45 Mille.
+6.216 Mille.
1.55%
1 gen 1988 anni
421.219 Mille.
+12.769 Mille.
3.13%
1 gen 1989 anni
492.894 Mille.
+71.675 Mille.
17.02%
1 gen 1990 anni
595.65 Mille.
+102.756 Mille.
20.85%
1 gen 1991 anni
537.669 Mille.
-57.981 Mille.
-9.73%
1 gen 1992 anni
546.582 Mille.
+8.913 Mille.
1.66%
1 gen 1993 anni
497.718 Mille.
-48.864 Mille.
-8.94%
1 gen 1994 anni
536.559 Mille.
+38.841 Mille.
7.8%
1 gen 1995 anni
658.225 Mille.
+121.665 Mille.
22.68%
1 gen 1996 anni
674.374 Mille.
+16.149 Mille.
2.45%
1 gen 1997 anni
571.276 Mille.
-103.098 Mille.
-15.29%
1 gen 1998 anni
956.985 Mille.
+385.709 Mille.
67.52%
1 gen 1999 anni
1.184 Mln
+227.029 Mille.
23.72%
1 gen 2000 anni
1.161 Mln
-22.909 Mille.
-1.93%
1 gen 2001 anni
984.408 Mille.
-176.697 Mille.
-15.22%
1 gen 2002 anni
1.064 Mln
+79.644 Mille.
8.09%
1 gen 2003 anni
1.208 Mln
+143.791 Mille.
13.51%
1 gen 2004 anni
1.108 Mln
-99.5 Mille.
-8.24%
1 gen 2005 anni
1.489 Mln
+380.799 Mille.
34.36%
1 gen 2006 anni
1.03 Mln
-459.32 Mille.
-30.84%
1 gen 2007 anni
1.227 Mln
+197.338 Mille.
19.16%
1 gen 2008 anni
1.168 Mln
-59.188 Mille.
-4.82%
1 gen 2009 anni
1.038 Mln
-129.595 Mille.
-11.1%
1 gen 2010 anni
1.238 Mln
+199.646 Mille.
19.23%
1 gen 2011 anni
878.071 Mille.
-359.953 Mille.
-29.07%
1 gen 2012 anni
1.144 Mln
+266.047 Mille.
30.3%
1 gen 2013 anni
1.144 Mln
0.0
0.0%
Classificazione dei paesi secondo i statistiche attuali per anni


Commenti: