29
/it/
it
AIzaSyAYiBZKx7MnpbEhh9jyipgxe19OcubqV5w
April 1, 2024
249182
Sri Lanka
LKA
true
2
1
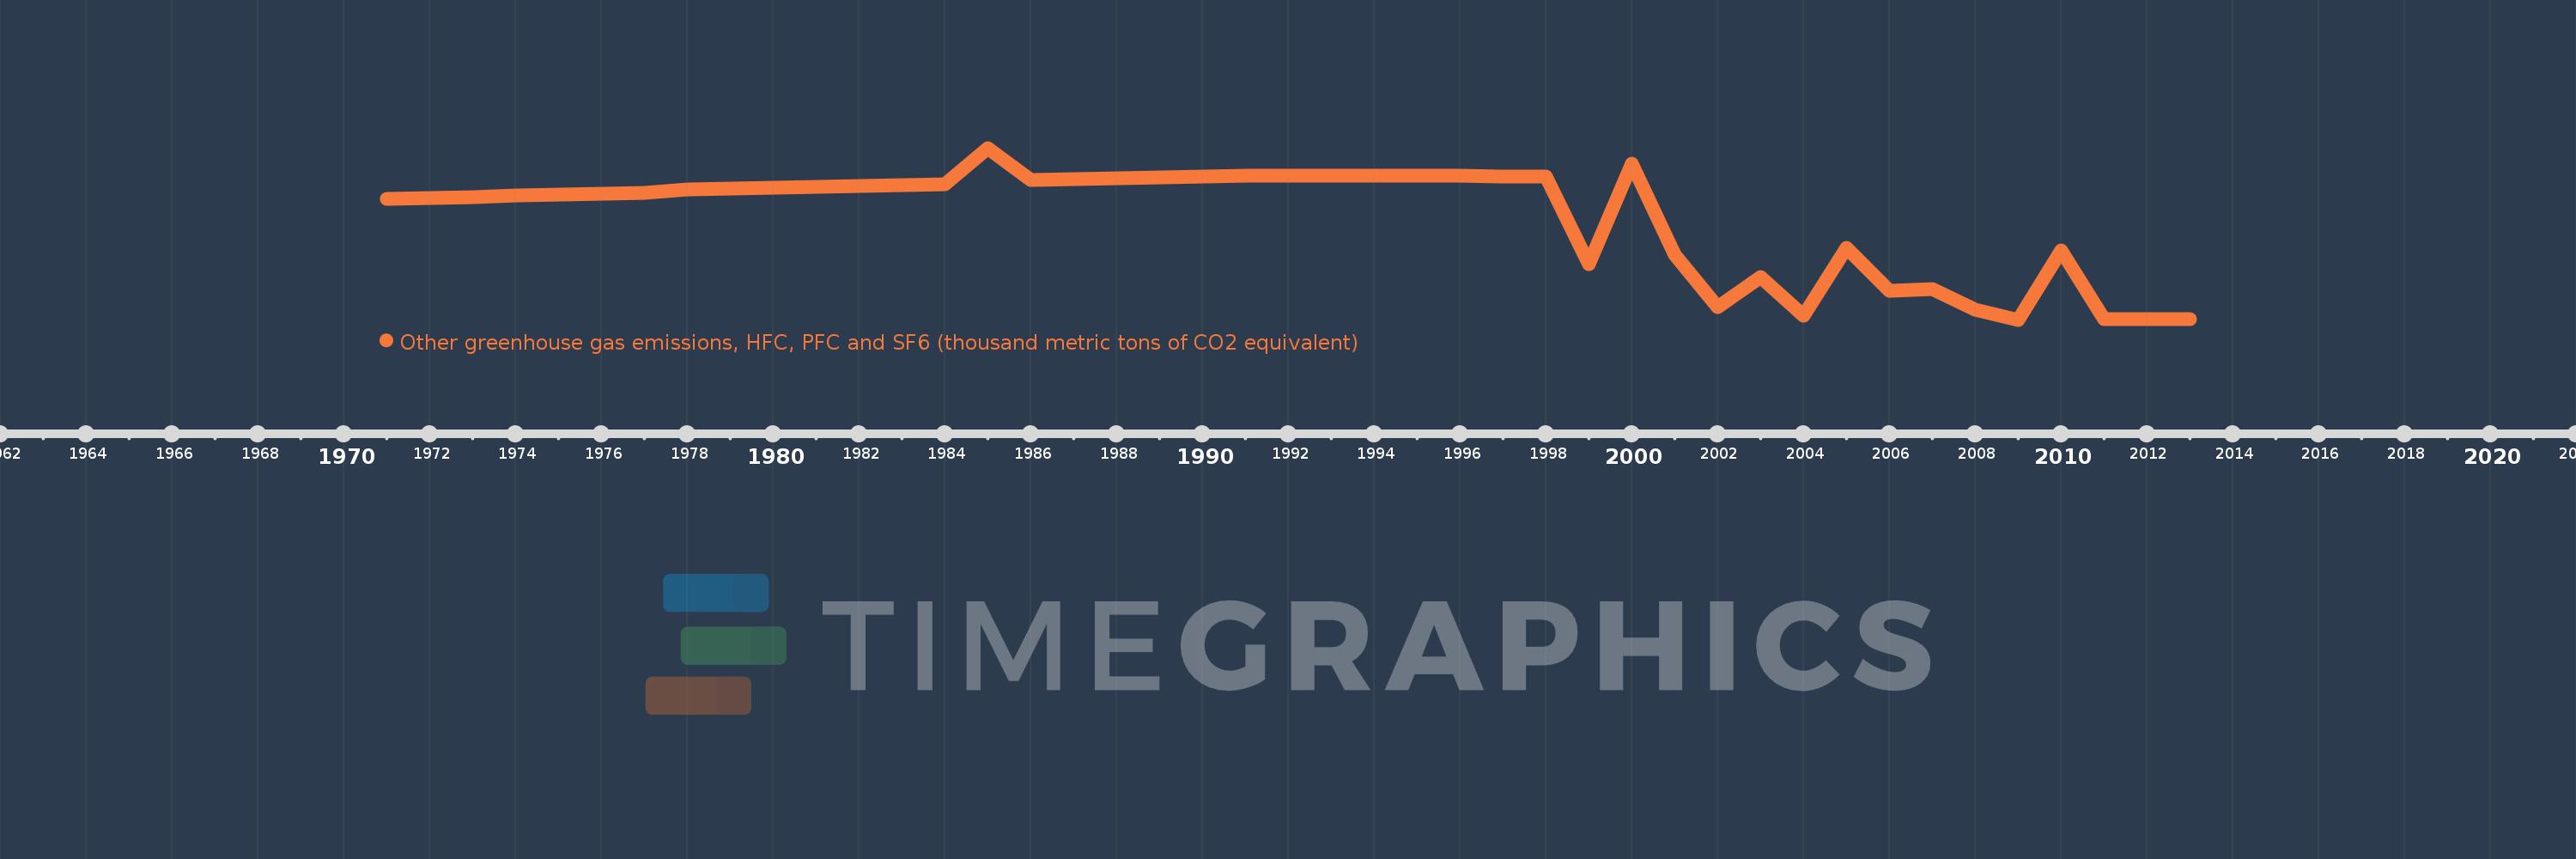
Other greenhouse gas emissions, HFC, PFC and SF6 (thousand metric tons of CO2 equivalent)
2013,2012,2011,2010,2009,2008,2007,2006,2005,2004,2003,2002,2001,2000,1999,1998,1997,1996,1995,1994,1993,1992,1991,1990,1989,1988,1987,1986,1985,1984,1983,1982,1981,1980,1979,1978,1977,1976,1975,1974,1973,1972,1971
Queste statistiche in altri paesi:
AfghanistanAlbaniaAlgeriaAmerican SamoaAngolaAntigua and BarbudaArab WorldArgentinaArmeniaArubaAustraliaAustriaAzerbaijanBahamas, TheBahrainBangladeshBarbadosBelarusBelgiumBelizeBeninBermudaBhutanBoliviaBosnia and HerzegovinaBotswanaBrazilBritish Virgin IslandsBrunei DarussalamBulgariaBurkina FasoBurundiCabo VerdeCambodiaCameroonCanadaCaribbean small statesCayman IslandsCentral African RepublicCentral Europe and the BalticsChadChileChinaColombiaComorosCongo, Dem. Rep.Congo, Rep.Costa RicaCote d'IvoireCroatiaCubaCyprusCzech RepublicDenmarkDjiboutiDominicaDominican RepublicEarly-demographic dividendEast Asia & PacificEast Asia & Pacific (excluding high income)East Asia & Pacific (IDA & IBRD countries)EcuadorEgypt, Arab Rep.El SalvadorEquatorial GuineaEritreaEstoniaEthiopiaEuro areaEurope & Central AsiaEurope & Central Asia (excluding high income)Europe & Central Asia (IDA & IBRD countries)European UnionFaroe IslandsFijiFinlandFragile and conflict affected situationsFranceFrench PolynesiaGabonGambia, TheGeorgiaGermanyGhanaGibraltarGreeceGreenlandGrenadaGuamGuatemalaGuineaGuinea-BissauGuyanaHaitiHeavily indebted poor countries (HIPC)High incomeHondurasHong Kong SAR, ChinaHungaryIBRD onlyIcelandIDA & IBRD totalIDA blendIDA onlyIDA totalIndiaIndonesiaIran, Islamic Rep.IraqIrelandIsraelItalyJamaicaJapanJordanKazakhstanKenyaKiribatiKorea, Dem. People’s Rep.Korea, Rep.KuwaitKyrgyz RepublicLao PDRLate-demographic dividendLatin America & Caribbean Latin America & Caribbean (excluding high income)Latin America & the Caribbean (IDA & IBRD countries)LatviaLeast developed countries: UN classificationLebanonLesothoLiberiaLibyaLithuaniaLow & middle incomeLow incomeLower middle incomeLuxembourgMacao SAR, ChinaMacedonia, FYRMadagascarMalawiMalaysiaMaldivesMaliMaltaMauritaniaMauritiusMexicoMiddle East & North AfricaMiddle East & North Africa (excluding high income)Middle East & North Africa (IDA & IBRD countries)Middle incomeMoldovaMongoliaMoroccoMozambiqueMyanmarNamibiaNauruNepalNetherlandsNew CaledoniaNew ZealandNicaraguaNigerNigeriaNorth AmericaNorwayOECD membersOmanOther small statesPacific island small statesPakistanPanamaPapua New GuineaParaguayPeruPhilippinesPolandPortugalPost-demographic dividendPre-demographic dividendPuerto RicoQatarRomaniaRussian FederationRwandaSamoaSao Tome and PrincipeSaudi ArabiaSenegalSeychellesSierra LeoneSingaporeSlovak RepublicSloveniaSmall statesSolomon IslandsSomaliaSouth AfricaSouth AsiaSouth Asia (IDA & IBRD)SpainSri LankaSt. Kitts and NevisSt. LuciaSt. Vincent and the GrenadinesSub-Saharan Africa Sub-Saharan Africa (excluding high income)Sub-Saharan Africa (IDA & IBRD countries)SudanSurinameSwazilandSwedenSwitzerlandSyrian Arab RepublicTajikistanTanzaniaThailandTimor-LesteTogoTongaTrinidad and TobagoTunisiaTurkeyTurkmenistanTurks and Caicos IslandsTuvaluUgandaUkraineUnited Arab EmiratesUnited KingdomUnited StatesUpper middle incomeUruguayUzbekistanVanuatuVenezuela, RBVietnamVirgin Islands (U.S.)WorldYemen, Rep.ZambiaZimbabwe Linea del tempo:
Questa scala temporale mostra un grafico dal 1971 anno al 2013 anno. Sri Lanka. I dati fino ad 1970 anno non disponibili. Il numero di osservazioni attuali secondo i date: 43.
La fonte (nome):
Indicatori dello sviluppo mondiale
La fonte (organizzazione):
World Bank staff estimates from original source: European Commission, Joint Research Centre (JRC)/Netherlands Environmental Assessment Agency (PBL). Emission Database for Global Atmospheric Research (EDGAR): http://edgar.jrc.ec.europa.eu/.
Categorie:
Climate Change, Environment
sono stati aggiornati
23 apr 2017 anni
Indicatori delle variazioni dei valori per anni
Minima:
86.214
1 gen 2009 anni
Massimo:
1.025 Mille.
1 gen 1985 anni
Alla data di osservazione
Valore
Variazione assoluta
La variazione rispetto al valore precedente
1 gen 1971 anni
747.823
+747.823
0.0%
1 gen 1972 anni
752.423
+4.6
0.62%
1 gen 1973 anni
757.023
+4.6
0.61%
1 gen 1974 anni
764.986
+7.963
1.05%
1 gen 1975 anni
769.586
+4.6
0.6%
1 gen 1976 anni
774.186
+4.6
0.6%
1 gen 1977 anni
778.786
+4.6
0.59%
1 gen 1978 anni
796.838
+18.052
2.32%
1 gen 1979 anni
804.801
+7.963
1.0%
1 gen 1980 anni
809.401
+4.6
0.57%
1 gen 1981 anni
814.001
+4.6
0.57%
1 gen 1982 anni
818.601
+4.6
0.57%
1 gen 1983 anni
823.201
+4.6
0.56%
1 gen 1984 anni
827.801
+4.6
0.56%
1 gen 1985 anni
1.025 Mille.
+196.902
23.79%
1 gen 1986 anni
850.453
-174.25
-17.0%
1 gen 1987 anni
855.053
+4.6
0.54%
1 gen 1988 anni
859.653
+4.6
0.54%
1 gen 1989 anni
864.253
+4.6
0.54%
1 gen 1990 anni
868.853
+4.6
0.53%
1 gen 1991 anni
873.453
+4.6
0.53%
1 gen 1992 anni
873.009
-0.444
-0.05%
1 gen 1993 anni
872.564
-0.444
-0.05%
1 gen 1994 anni
872.12
-0.444
-0.05%
1 gen 1995 anni
871.675
-0.444
-0.05%
1 gen 1996 anni
871.231
-0.445
-0.05%
1 gen 1997 anni
870.786
-0.444
-0.05%
1 gen 1998 anni
870.342
-0.444
-0.05%
1 gen 1999 anni
392.149
-478.193
-54.94%
1 gen 2000 anni
940.27
+548.121
139.77%
1 gen 2001 anni
441.388
-498.882
-53.06%
1 gen 2002 anni
155.87
-285.518
-64.69%
1 gen 2003 anni
321.136
+165.266
106.03%
1 gen 2004 anni
107.411
-213.725
-66.55%
1 gen 2005 anni
478.578
+371.167
345.56%
1 gen 2006 anni
242.205
-236.373
-49.39%
1 gen 2007 anni
253.43
+11.225
4.63%
1 gen 2008 anni
139.508
-113.922
-44.95%
1 gen 2009 anni
86.214
-53.294
-38.2%
1 gen 2010 anni
465.584
+379.37
440.03%
1 gen 2011 anni
90.951
-374.633
-80.47%
1 gen 2012 anni
90.951
+0.0
0.0%
1 gen 2013 anni
90.951
0.0
0.0%
Classificazione dei paesi secondo i statistiche attuali per anni


Commenti: