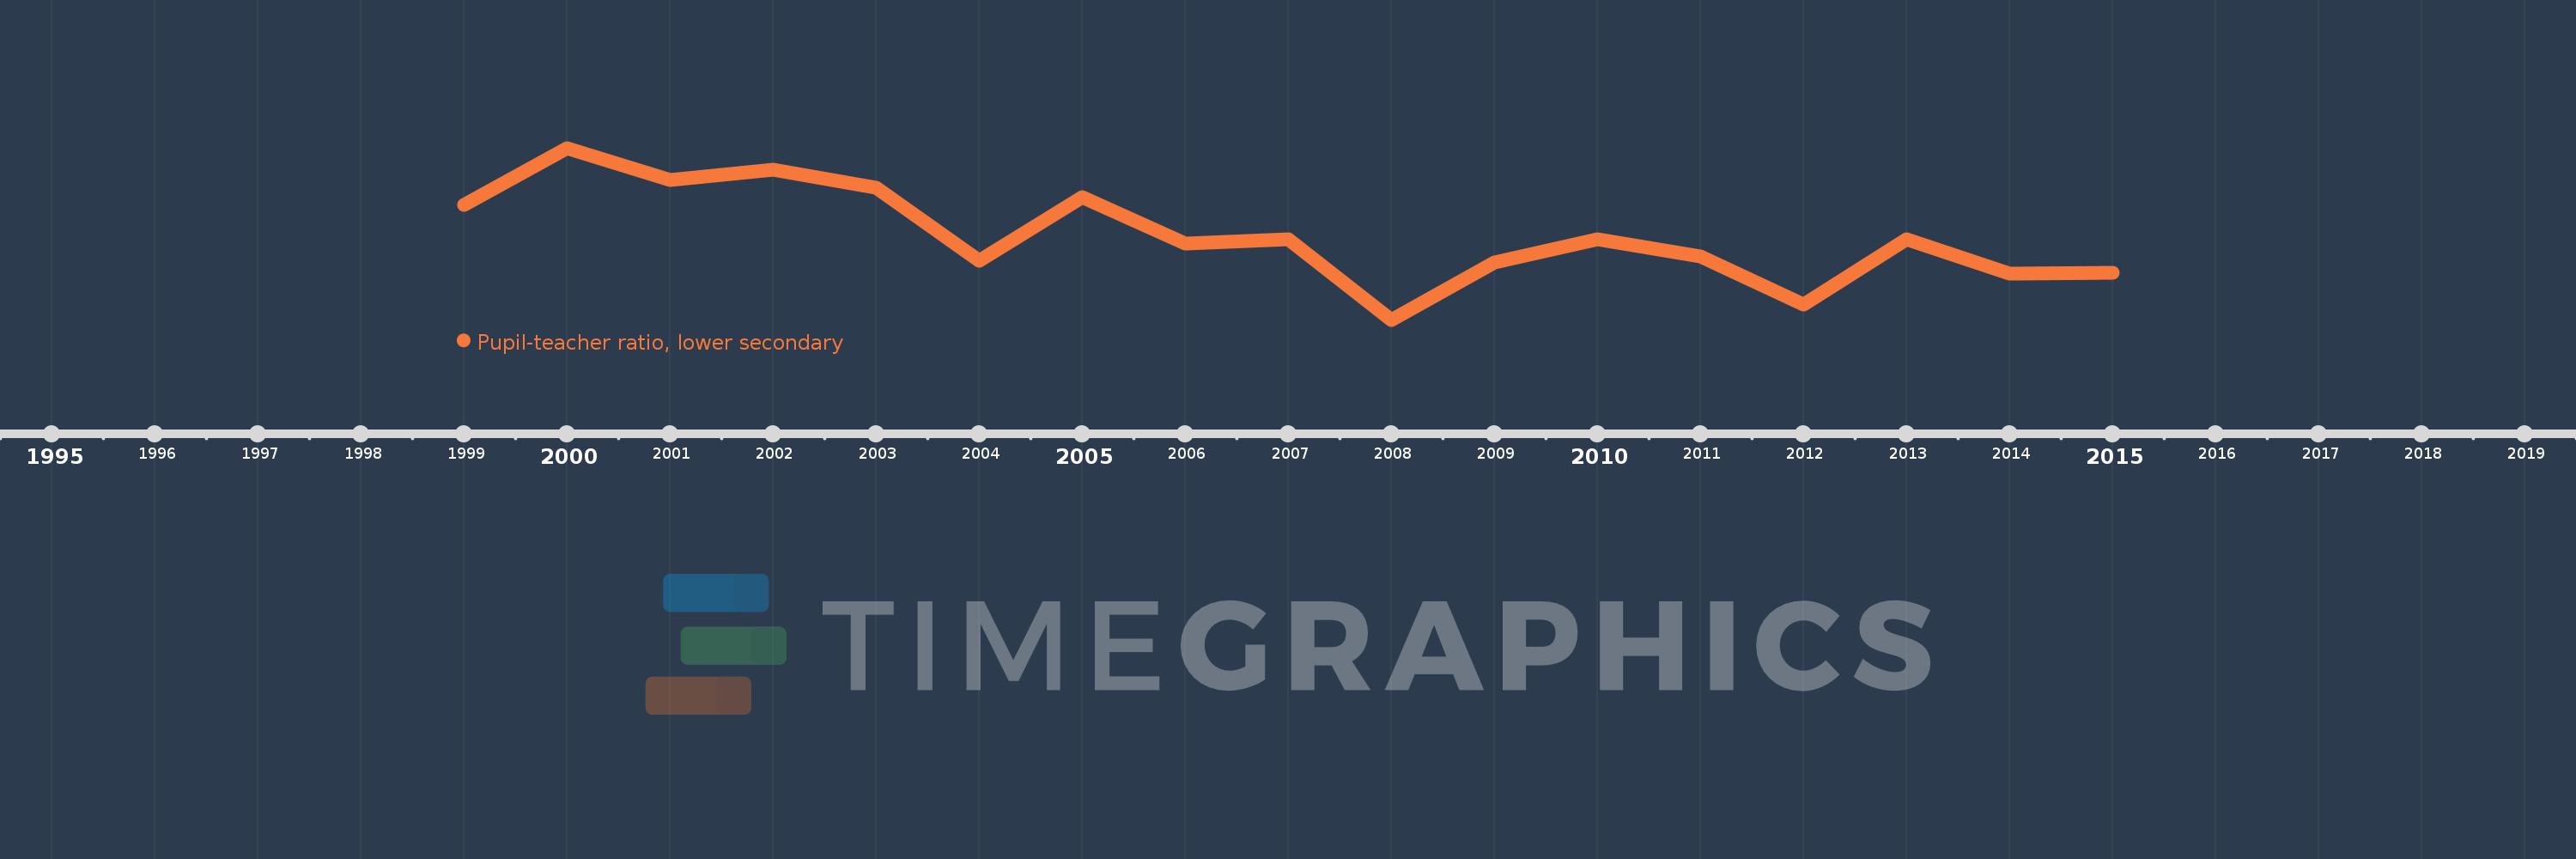
Questa scala temporale mostra un grafico dal 1999 anno al 2015 anno. Fragile and conflict affected situations. I dati fino ad 1998 anno non disponibili. Il numero di osservazioni attuali secondo i date: 17.
La fonte (nome):
Indicatori dello sviluppo mondiale
La fonte (organizzazione):
United Nations Educational, Scientific, and Cultural Organization (UNESCO) Institute for Statistics.
Categorie:
Education
sono stati aggiornati
23 apr 2017 anni
Indicatori delle variazioni dei valori per anni
In media:
23.525
Minima:
22.787
1 gen 2008 anni
Massimo:
24.286
1 gen 2000 anni
Alla data di osservazione
Valore
Variazione assoluta
La variazione rispetto al valore precedente
1 gen 1999 anni
23.791
+23.791
0.0%
1 gen 2000 anni
24.286
+0.494
2.08%
1 gen 2001 anni
24.007
-0.278
-1.15%
1 gen 2002 anni
24.095
+0.088
0.37%
1 gen 2003 anni
23.939
-0.156
-0.65%
1 gen 2004 anni
23.3
-0.639
-2.67%
1 gen 2005 anni
23.854
+0.554
2.38%
1 gen 2006 anni
23.455
-0.399
-1.67%
1 gen 2007 anni
23.487
+0.032
0.14%
1 gen 2008 anni
22.787
-0.7
-2.98%
1 gen 2009 anni
23.286
+0.498
2.19%
1 gen 2010 anni
23.487
+0.202
0.87%
1 gen 2011 anni
23.341
-0.147
-0.62%
1 gen 2012 anni
22.923
-0.417
-1.79%
1 gen 2013 anni
23.492
+0.568
2.48%
1 gen 2014 anni
23.191
-0.301
-1.28%
1 gen 2015 anni
23.197
+0.006
0.03%
Classificazione dei paesi secondo i statistiche attuali per anni
