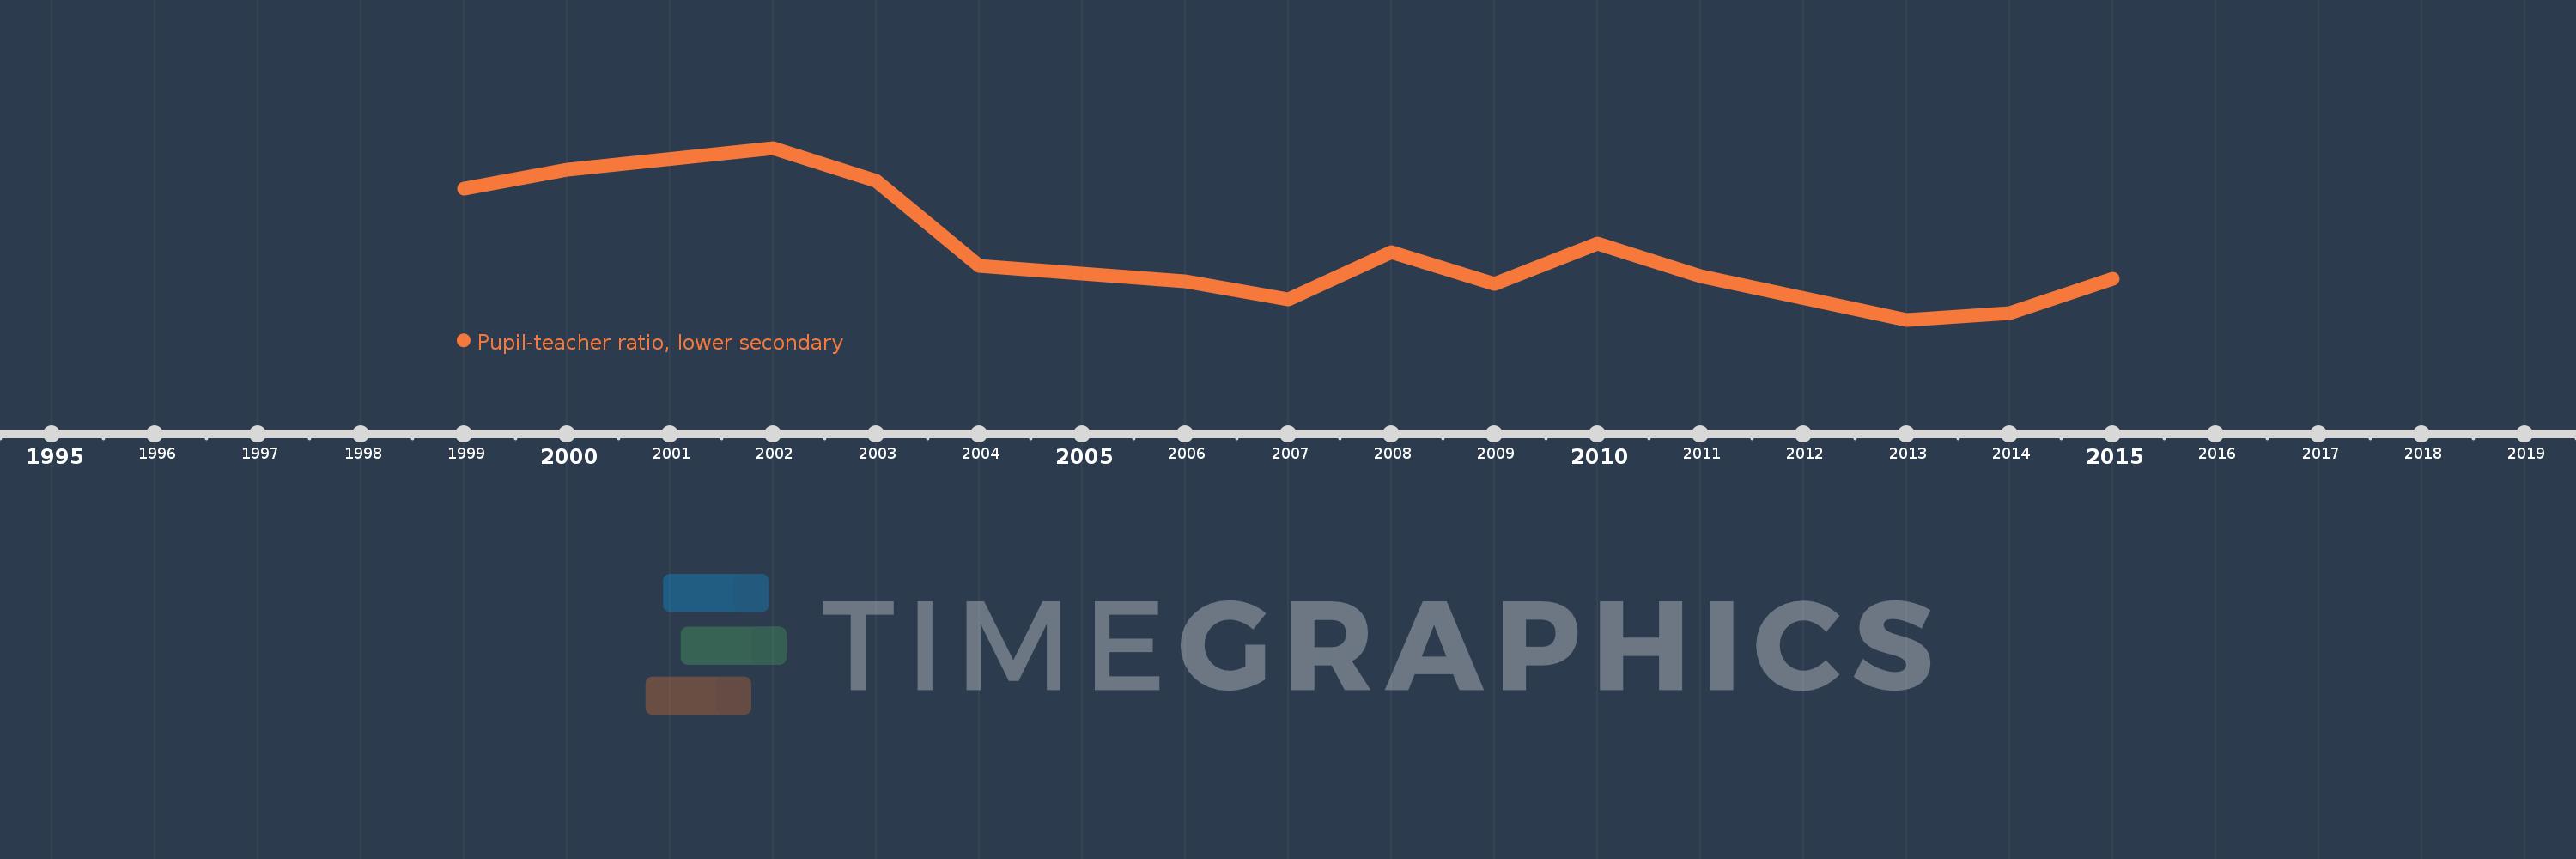
Questa scala temporale mostra un grafico dal 1999 anno al 2015 anno. Qatar. I dati fino ad 1998 anno non disponibili. Il numero di osservazioni attuali secondo i date: 15.
La fonte (nome):
Indicatori dello sviluppo mondiale
La fonte (organizzazione):
United Nations Educational, Scientific, and Cultural Organization (UNESCO) Institute for Statistics.
Categorie:
Education
sono stati aggiornati
23 apr 2017 anni
Indicatori delle variazioni dei valori per anni
In media:
11.283
Minima:
9.983
1 gen 2013 anni
Massimo:
13.263
1 gen 2002 anni
Alla data di osservazione
Valore
Variazione assoluta
La variazione rispetto al valore precedente
1 gen 1999 anni
12.49
+12.49
0.0%
1 gen 2000 anni
12.845
+0.355
2.84%
1 gen 2002 anni
13.263
+0.419
3.26%
1 gen 2003 anni
12.633
-0.631
-4.75%
1 gen 2004 anni
11.01
-1.623
-12.84%
1 gen 2005 anni
10.859
-0.151
-1.37%
1 gen 2006 anni
10.716
-0.143
-1.32%
1 gen 2007 anni
10.373
-0.343
-3.2%
1 gen 2008 anni
11.279
+0.906
8.73%
1 gen 2009 anni
10.668
-0.611
-5.42%
1 gen 2010 anni
11.434
+0.766
7.18%
1 gen 2011 anni
10.815
-0.619
-5.42%
1 gen 2013 anni
9.983
-0.832
-7.69%
1 gen 2014 anni
10.117
+0.134
1.34%
1 gen 2015 anni
10.763
+0.646
6.39%
Classificazione dei paesi secondo i statistiche attuali per anni
