29
/it/
it
AIzaSyAYiBZKx7MnpbEhh9jyipgxe19OcubqV5w
April 1, 2024
34395
Fragile and conflict affected situations
FCS
false
2
1
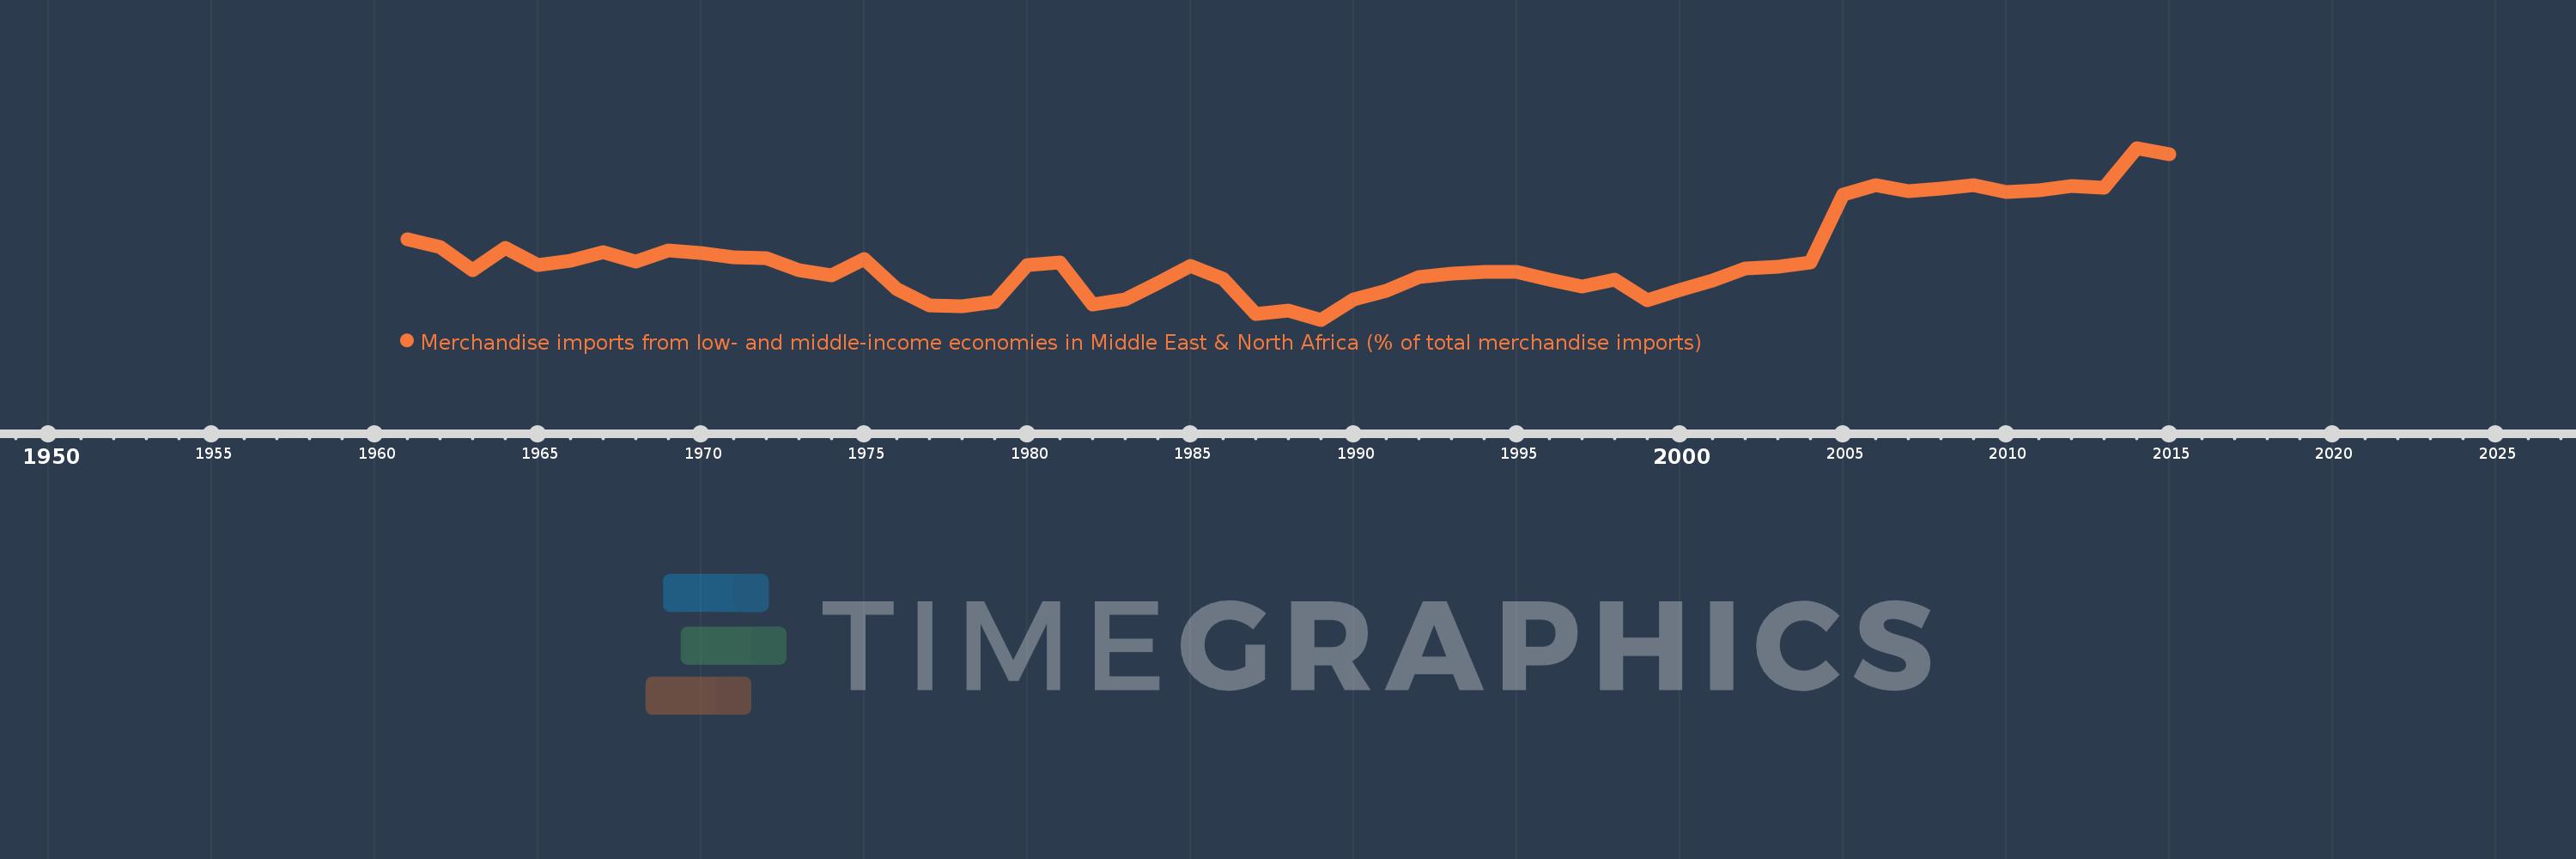
Merchandise imports from low- and middle-income economies in Middle East & North Africa (% of total merchandise imports)
2015,2014,2013,2012,2011,2010,2009,2008,2007,2006,2005,2004,2003,2002,2001,2000,1999,1998,1997,1996,1995,1994,1993,1992,1991,1990,1989,1988,1987,1986,1985,1984,1983,1982,1981,1980,1979,1978,1977,1976,1975,1974,1973,1972,1971,1970,1969,1968,1967,1966,1965,1964,1963,1962,1961
Queste statistiche in altri paesi:
AfghanistanAlbaniaAlgeriaAngolaArab WorldArgentinaArmeniaArubaAustraliaAustriaAzerbaijanBahamas, TheBahrainBangladeshBarbadosBelarusBelgiumBelizeBeninBermudaBoliviaBosnia and HerzegovinaBrazilBrunei DarussalamBulgariaBurkina FasoBurundiCabo VerdeCambodiaCameroonCanadaCaribbean small statesCentral African RepublicCentral Europe and the BalticsChadChileChinaColombiaComorosCongo, Dem. Rep.Congo, Rep.Costa RicaCote d'IvoireCroatiaCubaCyprusCzech RepublicDenmarkDjiboutiDominicaDominican RepublicEarly-demographic dividendEast Asia & PacificEast Asia & Pacific (excluding high income)East Asia & Pacific (IDA & IBRD countries)EcuadorEgypt, Arab Rep.El SalvadorEstoniaEthiopiaEuro areaEurope & Central AsiaEurope & Central Asia (excluding high income)Europe & Central Asia (IDA & IBRD countries)European UnionFijiFinlandFragile and conflict affected situationsFranceFrench PolynesiaGabonGambia, TheGeorgiaGermanyGhanaGreeceGreenlandGrenadaGuatemalaGuineaGuinea-BissauGuyanaHaitiHeavily indebted poor countries (HIPC)High incomeHondurasHong Kong SAR, ChinaHungaryIBRD onlyIcelandIDA & IBRD totalIDA blendIDA onlyIDA totalIndiaIndonesiaIran, Islamic Rep.IraqIrelandIsraelItalyJamaicaJapanJordanKazakhstanKenyaKorea, Dem. People’s Rep.Korea, Rep.KosovoKuwaitKyrgyz RepublicLao PDRLate-demographic dividendLatin America & Caribbean Latin America & Caribbean (excluding high income)Latin America & the Caribbean (IDA & IBRD countries)LatviaLeast developed countries: UN classificationLebanonLiberiaLibyaLithuaniaLow & middle incomeLow incomeLower middle incomeLuxembourgMacao SAR, ChinaMacedonia, FYRMadagascarMalawiMalaysiaMaldivesMaliMaltaMauritaniaMauritiusMexicoMiddle East & North AfricaMiddle East & North Africa (excluding high income)Middle East & North Africa (IDA & IBRD countries)Middle incomeMoldovaMongoliaMontenegroMoroccoMozambiqueMyanmarNepalNetherlandsNew CaledoniaNew ZealandNicaraguaNigerNigeriaNorth AmericaNorwayOECD membersOmanOther small statesPacific island small statesPakistanPanamaPapua New GuineaParaguayPeruPhilippinesPolandPortugalPost-demographic dividendPre-demographic dividendQatarRomaniaRussian FederationRwandaSamoaSaudi ArabiaSenegalSerbiaSeychellesSierra LeoneSingaporeSlovak RepublicSloveniaSmall statesSomaliaSouth AfricaSouth AsiaSouth Asia (IDA & IBRD)SpainSri LankaSt. Kitts and NevisSt. LuciaSt. Vincent and the GrenadinesSub-Saharan Africa Sub-Saharan Africa (excluding high income)Sub-Saharan Africa (IDA & IBRD countries)SudanSurinameSwedenSwitzerlandSyrian Arab RepublicTajikistanTanzaniaThailandTogoTrinidad and TobagoTunisiaTurkeyTurkmenistanUgandaUkraineUnited Arab EmiratesUnited KingdomUnited StatesUpper middle incomeUruguayUzbekistanVenezuela, RBVietnamWorldYemen, Rep.ZambiaZimbabwe Linea del tempo:
Questa scala temporale mostra un grafico dal 1961 anno al 2015 anno. Fragile and conflict affected situations. I dati fino ad 1960 anno non disponibili. Il numero di osservazioni attuali secondo i date: 55.
La fonte (nome):
Indicatori dello sviluppo mondiale
La fonte (organizzazione):
World Bank staff estimates based data from International Monetary Fund's Direction of Trade database.
Categorie:
Private Sector, Trade
sono stati aggiornati
23 apr 2017 anni
Indicatori delle variazioni dei valori per anni
Minima:
2.525
1 gen 1989 anni
Massimo:
12.078
1 gen 2014 anni
Alla data di osservazione
Valore
Variazione assoluta
La variazione rispetto al valore precedente
1 gen 1961 anni
7.003
+7.003
0.0%
1 gen 1962 anni
6.585
-0.419
-5.98%
1 gen 1963 anni
5.286
-1.299
-19.73%
1 gen 1964 anni
6.509
+1.224
23.15%
1 gen 1965 anni
5.569
-0.94
-14.44%
1 gen 1966 anni
5.793
+0.223
4.01%
1 gen 1967 anni
6.268
+0.475
8.21%
1 gen 1968 anni
5.746
-0.522
-8.33%
1 gen 1969 anni
6.367
+0.621
10.8%
1 gen 1970 anni
6.231
-0.136
-2.13%
1 gen 1971 anni
6.02
-0.211
-3.39%
1 gen 1972 anni
5.962
-0.058
-0.96%
1 gen 1973 anni
5.26
-0.702
-11.78%
1 gen 1974 anni
5.012
-0.247
-4.7%
1 gen 1975 anni
5.921
+0.908
18.12%
1 gen 1976 anni
4.208
-1.713
-28.93%
1 gen 1977 anni
3.321
-0.887
-21.08%
1 gen 1978 anni
3.279
-0.042
-1.26%
1 gen 1979 anni
3.531
+0.252
7.68%
1 gen 1980 anni
5.586
+2.055
58.2%
1 gen 1981 anni
5.698
+0.112
2.0%
1 gen 1982 anni
3.349
-2.349
-41.22%
1 gen 1983 anni
3.656
+0.307
9.16%
1 gen 1984 anni
4.581
+0.924
25.28%
1 gen 1985 anni
5.52
+0.939
20.5%
1 gen 1986 anni
4.816
-0.704
-12.76%
1 gen 1987 anni
2.824
-1.991
-41.35%
1 gen 1988 anni
3.037
+0.213
7.53%
1 gen 1989 anni
2.525
-0.512
-16.85%
1 gen 1990 anni
3.65
+1.126
44.58%
1 gen 1991 anni
4.149
+0.499
13.66%
1 gen 1992 anni
4.893
+0.743
17.91%
1 gen 1993 anni
5.094
+0.201
4.12%
1 gen 1994 anni
5.208
+0.114
2.23%
1 gen 1995 anni
5.183
-0.025
-0.48%
1 gen 1996 anni
4.739
-0.444
-8.56%
1 gen 1997 anni
4.381
-0.359
-7.57%
1 gen 1998 anni
4.751
+0.37
8.45%
1 gen 1999 anni
3.625
-1.126
-23.7%
1 gen 2000 anni
4.178
+0.553
15.27%
1 gen 2001 anni
4.718
+0.539
12.91%
1 gen 2002 anni
5.385
+0.668
14.15%
1 gen 2003 anni
5.461
+0.075
1.4%
1 gen 2004 anni
5.704
+0.244
4.46%
1 gen 2005 anni
9.472
+3.767
66.04%
1 gen 2006 anni
9.992
+0.52
5.49%
1 gen 2007 anni
9.697
-0.295
-2.95%
1 gen 2008 anni
9.825
+0.128
1.32%
1 gen 2009 anni
10.019
+0.194
1.97%
1 gen 2010 anni
9.651
-0.368
-3.68%
1 gen 2011 anni
9.731
+0.08
0.83%
1 gen 2012 anni
9.977
+0.246
2.53%
1 gen 2013 anni
9.856
-0.12
-1.21%
1 gen 2014 anni
12.078
+2.222
22.55%
1 gen 2015 anni
11.752
-0.327
-2.7%
Classificazione dei paesi secondo i statistiche attuali per anni


Commenti: