29
/it/
it
AIzaSyAYiBZKx7MnpbEhh9jyipgxe19OcubqV5w
April 1, 2024
159676
Ireland
IRL
true
2
1
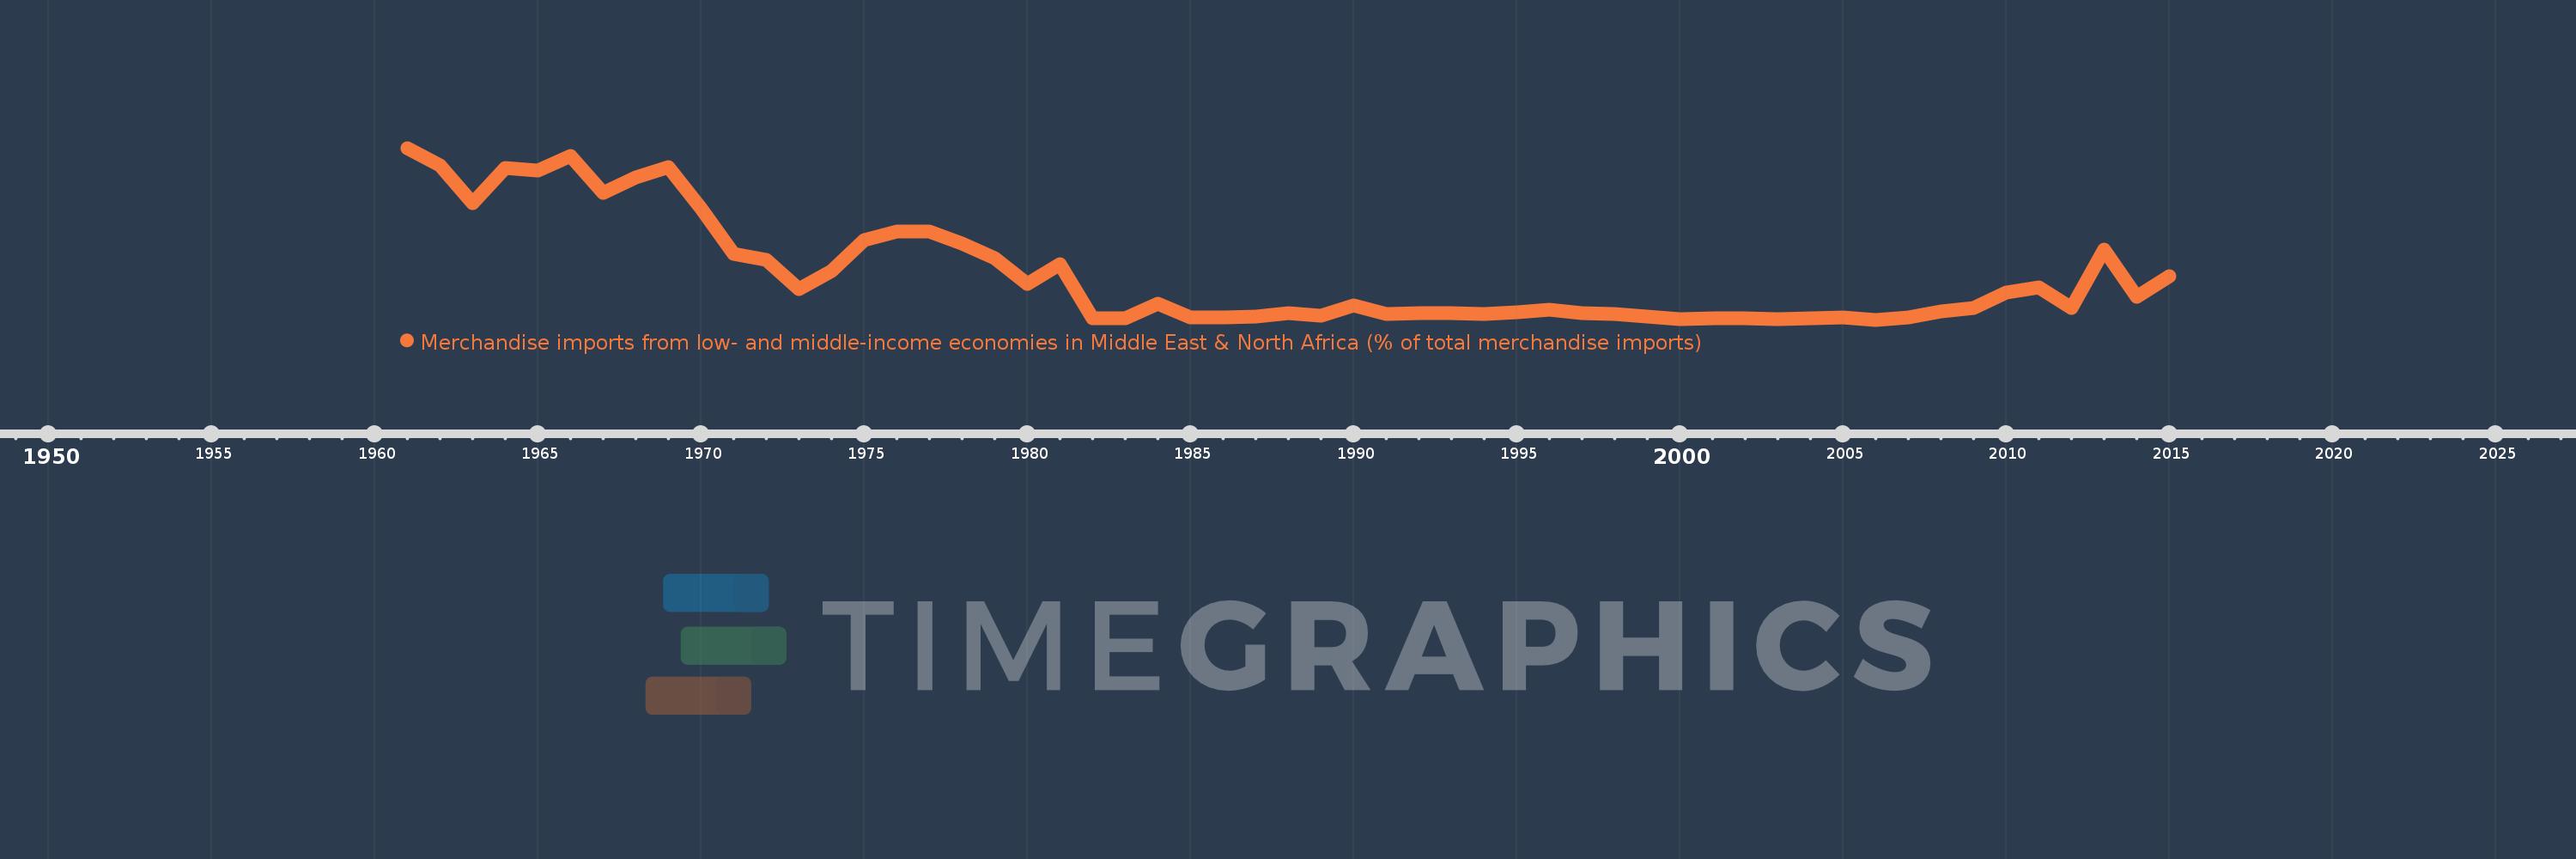
Merchandise imports from low- and middle-income economies in Middle East & North Africa (% of total merchandise imports)
2015,2014,2013,2012,2011,2010,2009,2008,2007,2006,2005,2004,2003,2002,2001,2000,1999,1998,1997,1996,1995,1994,1993,1992,1991,1990,1989,1988,1987,1986,1985,1984,1983,1982,1981,1980,1979,1978,1977,1976,1975,1974,1973,1972,1971,1970,1969,1968,1967,1966,1965,1964,1963,1962,1961
Queste statistiche in altri paesi:
AfghanistanAlbaniaAlgeriaAngolaArab WorldArgentinaArmeniaArubaAustraliaAustriaAzerbaijanBahamas, TheBahrainBangladeshBarbadosBelarusBelgiumBelizeBeninBermudaBoliviaBosnia and HerzegovinaBrazilBrunei DarussalamBulgariaBurkina FasoBurundiCabo VerdeCambodiaCameroonCanadaCaribbean small statesCentral African RepublicCentral Europe and the BalticsChadChileChinaColombiaComorosCongo, Dem. Rep.Congo, Rep.Costa RicaCote d'IvoireCroatiaCubaCyprusCzech RepublicDenmarkDjiboutiDominicaDominican RepublicEarly-demographic dividendEast Asia & PacificEast Asia & Pacific (excluding high income)East Asia & Pacific (IDA & IBRD countries)EcuadorEgypt, Arab Rep.El SalvadorEstoniaEthiopiaEuro areaEurope & Central AsiaEurope & Central Asia (excluding high income)Europe & Central Asia (IDA & IBRD countries)European UnionFijiFinlandFragile and conflict affected situationsFranceFrench PolynesiaGabonGambia, TheGeorgiaGermanyGhanaGreeceGreenlandGrenadaGuatemalaGuineaGuinea-BissauGuyanaHaitiHeavily indebted poor countries (HIPC)High incomeHondurasHong Kong SAR, ChinaHungaryIBRD onlyIcelandIDA & IBRD totalIDA blendIDA onlyIDA totalIndiaIndonesiaIran, Islamic Rep.IraqIrelandIsraelItalyJamaicaJapanJordanKazakhstanKenyaKorea, Dem. People’s Rep.Korea, Rep.KosovoKuwaitKyrgyz RepublicLao PDRLate-demographic dividendLatin America & Caribbean Latin America & Caribbean (excluding high income)Latin America & the Caribbean (IDA & IBRD countries)LatviaLeast developed countries: UN classificationLebanonLiberiaLibyaLithuaniaLow & middle incomeLow incomeLower middle incomeLuxembourgMacao SAR, ChinaMacedonia, FYRMadagascarMalawiMalaysiaMaldivesMaliMaltaMauritaniaMauritiusMexicoMiddle East & North AfricaMiddle East & North Africa (excluding high income)Middle East & North Africa (IDA & IBRD countries)Middle incomeMoldovaMongoliaMontenegroMoroccoMozambiqueMyanmarNepalNetherlandsNew CaledoniaNew ZealandNicaraguaNigerNigeriaNorth AmericaNorwayOECD membersOmanOther small statesPacific island small statesPakistanPanamaPapua New GuineaParaguayPeruPhilippinesPolandPortugalPost-demographic dividendPre-demographic dividendQatarRomaniaRussian FederationRwandaSamoaSaudi ArabiaSenegalSerbiaSeychellesSierra LeoneSingaporeSlovak RepublicSloveniaSmall statesSomaliaSouth AfricaSouth AsiaSouth Asia (IDA & IBRD)SpainSri LankaSt. Kitts and NevisSt. LuciaSt. Vincent and the GrenadinesSub-Saharan Africa Sub-Saharan Africa (excluding high income)Sub-Saharan Africa (IDA & IBRD countries)SudanSurinameSwedenSwitzerlandSyrian Arab RepublicTajikistanTanzaniaThailandTogoTrinidad and TobagoTunisiaTurkeyTurkmenistanUgandaUkraineUnited Arab EmiratesUnited KingdomUnited StatesUpper middle incomeUruguayUzbekistanVenezuela, RBVietnamWorldYemen, Rep.ZambiaZimbabwe Linea del tempo:
Questa scala temporale mostra un grafico dal 1961 anno al 2015 anno. Ireland. I dati fino ad 1960 anno non disponibili. Il numero di osservazioni attuali secondo i date: 55.
La fonte (nome):
Indicatori dello sviluppo mondiale
La fonte (organizzazione):
World Bank staff estimates based data from International Monetary Fund's Direction of Trade database.
Categorie:
Private Sector, Trade
sono stati aggiornati
23 apr 2017 anni
Indicatori delle variazioni dei valori per anni
Minima:
0.099
1 gen 2006 anni
Massimo:
4.255
1 gen 1961 anni
Alla data di osservazione
Valore
Variazione assoluta
La variazione rispetto al valore precedente
1 gen 1961 anni
4.255
+4.255
0.0%
1 gen 1962 anni
3.842
-0.413
-9.7%
1 gen 1963 anni
2.921
-0.921
-23.98%
1 gen 1964 anni
3.778
+0.857
29.35%
1 gen 1965 anni
3.699
-0.079
-2.08%
1 gen 1966 anni
4.061
+0.361
9.77%
1 gen 1967 anni
3.178
-0.883
-21.75%
1 gen 1968 anni
3.55
+0.372
11.7%
1 gen 1969 anni
3.783
+0.234
6.58%
1 gen 1970 anni
2.789
-0.994
-26.28%
1 gen 1971 anni
1.69
-1.099
-39.42%
1 gen 1972 anni
1.555
-0.134
-7.94%
1 gen 1973 anni
0.844
-0.711
-45.72%
1 gen 1974 anni
1.269
+0.425
50.33%
1 gen 1975 anni
2.018
+0.749
58.99%
1 gen 1976 anni
2.234
+0.216
10.69%
1 gen 1977 anni
2.224
-0.01
-0.45%
1 gen 1978 anni
1.939
-0.285
-12.81%
1 gen 1979 anni
1.597
-0.342
-17.63%
1 gen 1980 anni
0.968
-0.629
-39.39%
1 gen 1981 anni
1.449
+0.481
49.69%
1 gen 1982 anni
0.136
-1.313
-90.62%
1 gen 1983 anni
0.142
+0.007
4.82%
1 gen 1984 anni
0.494
+0.351
246.62%
1 gen 1985 anni
0.155
-0.339
-68.61%
1 gen 1986 anni
0.158
+0.003
1.93%
1 gen 1987 anni
0.172
+0.014
9.1%
1 gen 1988 anni
0.252
+0.079
45.99%
1 gen 1989 anni
0.204
-0.048
-19.04%
1 gen 1990 anni
0.444
+0.24
117.87%
1 gen 1991 anni
0.233
-0.211
-47.51%
1 gen 1992 anni
0.254
+0.021
9.15%
1 gen 1993 anni
0.261
+0.006
2.48%
1 gen 1994 anni
0.234
-0.027
-10.21%
1 gen 1995 anni
0.283
+0.049
20.95%
1 gen 1996 anni
0.341
+0.058
20.61%
1 gen 1997 anni
0.259
-0.083
-24.22%
1 gen 1998 anni
0.236
-0.023
-8.93%
1 gen 1999 anni
0.175
-0.061
-25.82%
1 gen 2000 anni
0.122
-0.052
-30.02%
1 gen 2001 anni
0.124
+0.001
1.11%
1 gen 2002 anni
0.137
+0.013
10.57%
1 gen 2003 anni
0.114
-0.023
-16.47%
1 gen 2004 anni
0.132
+0.018
15.65%
1 gen 2005 anni
0.155
+0.023
17.07%
1 gen 2006 anni
0.099
-0.056
-36.07%
1 gen 2007 anni
0.157
+0.058
58.53%
1 gen 2008 anni
0.293
+0.136
86.76%
1 gen 2009 anni
0.392
+0.099
33.82%
1 gen 2010 anni
0.765
+0.373
95.24%
1 gen 2011 anni
0.876
+0.111
14.53%
1 gen 2012 anni
0.393
-0.483
-55.16%
1 gen 2013 anni
1.789
+1.396
355.42%
1 gen 2014 anni
0.649
-1.14
-63.71%
1 gen 2015 anni
1.15
+0.501
77.2%
Classificazione dei paesi secondo i statistiche attuali per anni


Commenti: