29
/it/
it
AIzaSyAYiBZKx7MnpbEhh9jyipgxe19OcubqV5w
April 1, 2024
34364
Fragile and conflict affected situations
FCS
false
2
1
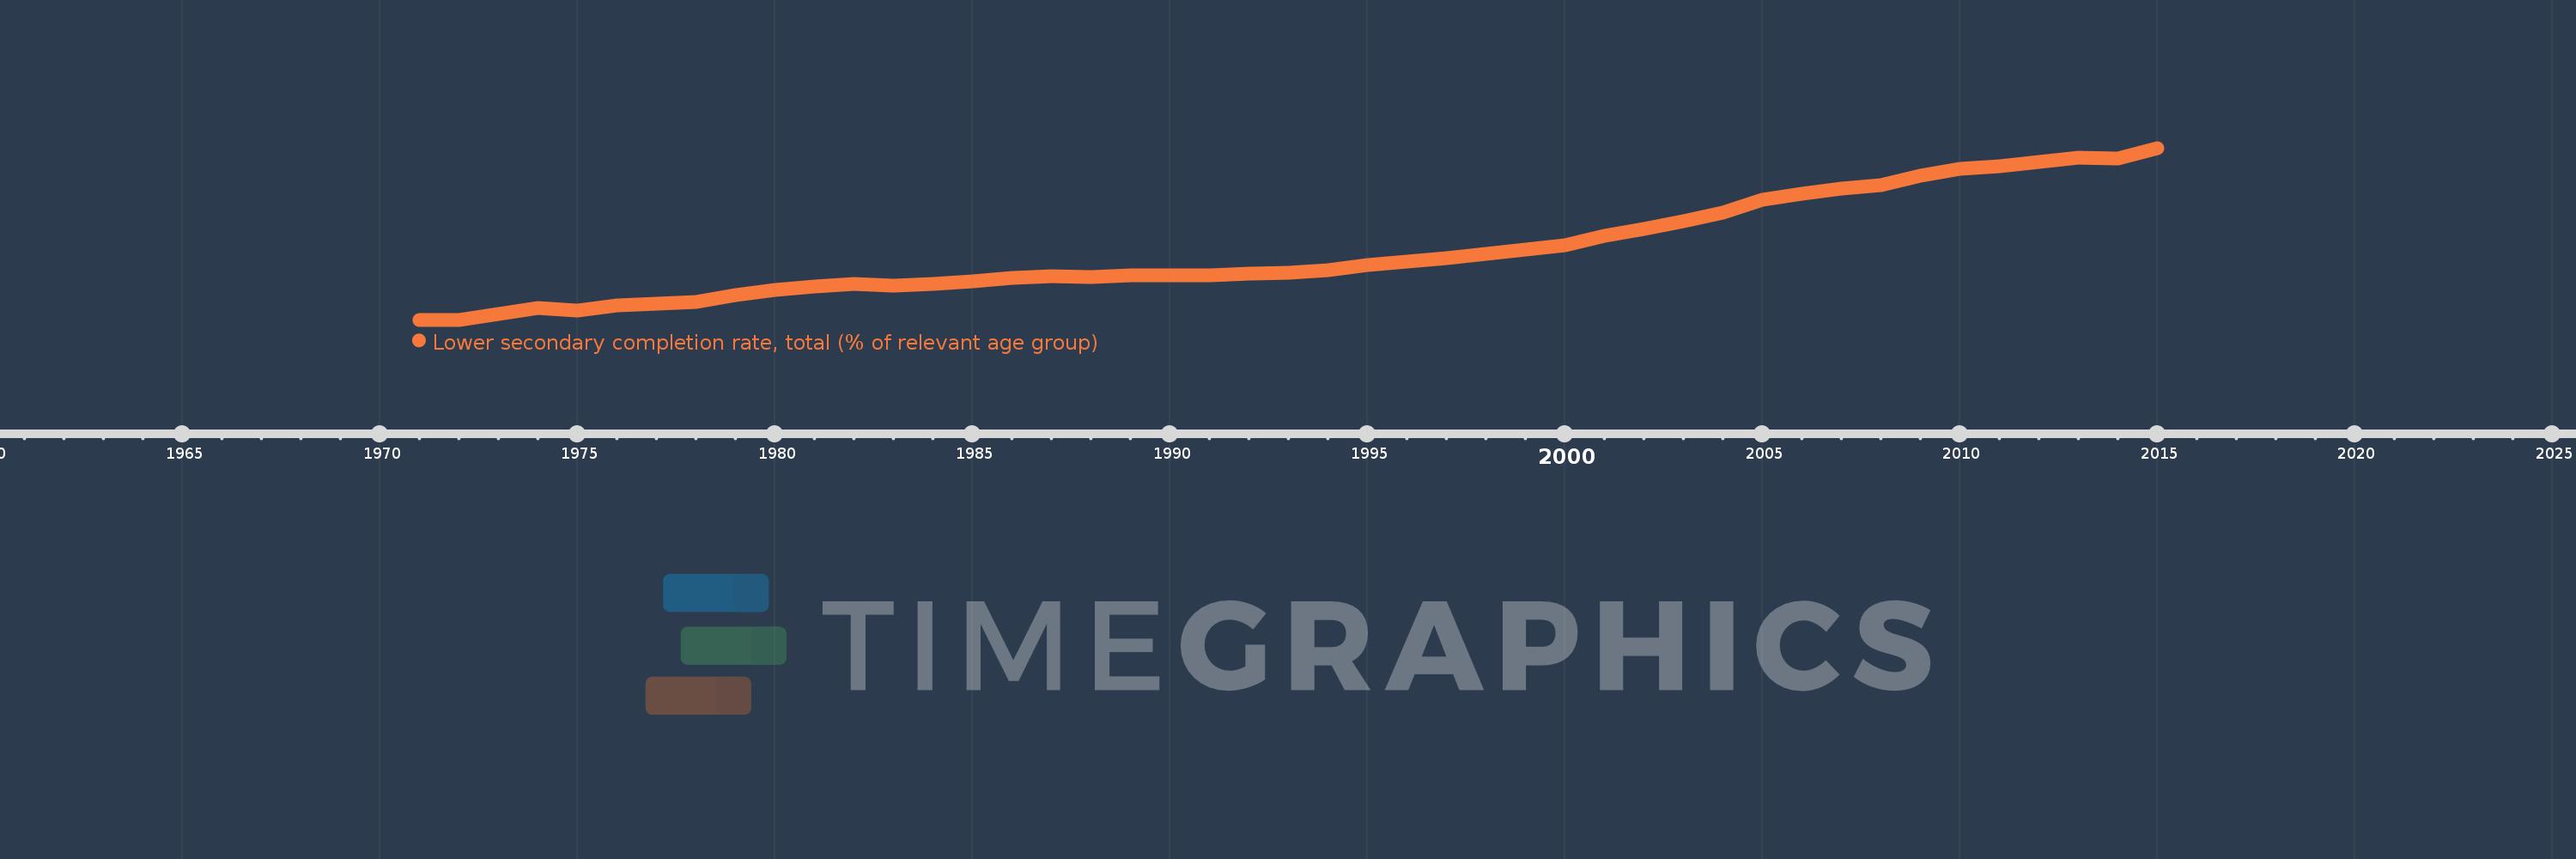
Lower secondary completion rate, total (% of relevant age group)
2015,2014,2013,2012,2011,2010,2009,2008,2007,2006,2005,2004,2003,2002,2001,2000,1999,1998,1997,1996,1995,1994,1993,1992,1991,1990,1989,1988,1987,1986,1985,1984,1983,1982,1981,1980,1979,1978,1977,1976,1975,1974,1973,1972,1971
Queste statistiche in altri paesi:
AfghanistanAlbaniaAlgeriaAngolaAntigua and BarbudaArab WorldArgentinaArmeniaArubaAustriaAzerbaijanBahamas, TheBahrainBangladeshBarbadosBelarusBelgiumBelizeBeninBermudaBhutanBoliviaBosnia and HerzegovinaBotswanaBrazilBritish Virgin IslandsBrunei DarussalamBulgariaBurkina FasoBurundiCabo VerdeCambodiaCameroonCaribbean small statesCentral African RepublicCentral Europe and the BalticsChadChileChinaColombiaComorosCongo, Dem. Rep.Congo, Rep.Costa RicaCote d'IvoireCroatiaCubaCyprusCzech RepublicDenmarkDjiboutiDominicaDominican RepublicEarly-demographic dividendEast Asia & PacificEast Asia & Pacific (excluding high income)East Asia & Pacific (IDA & IBRD countries)EcuadorEgypt, Arab Rep.El SalvadorEquatorial GuineaEritreaEstoniaEthiopiaEuro areaEurope & Central AsiaEurope & Central Asia (excluding high income)Europe & Central Asia (IDA & IBRD countries)European UnionFijiFinlandFragile and conflict affected situationsFranceGabonGambia, TheGeorgiaGermanyGhanaGreeceGrenadaGuatemalaGuineaGuinea-BissauGuyanaHaitiHeavily indebted poor countries (HIPC)High incomeHondurasHong Kong SAR, ChinaHungaryIBRD onlyIcelandIDA & IBRD totalIDA blendIDA onlyIDA totalIndiaIndonesiaIran, Islamic Rep.IraqIrelandIsraelItalyJamaicaJapanJordanKazakhstanKenyaKiribatiKorea, Dem. People’s Rep.Korea, Rep.KuwaitKyrgyz RepublicLao PDRLate-demographic dividendLatin America & Caribbean Latin America & Caribbean (excluding high income)Latin America & the Caribbean (IDA & IBRD countries)LatviaLeast developed countries: UN classificationLebanonLesothoLiberiaLiechtensteinLithuaniaLow & middle incomeLow incomeLower middle incomeLuxembourgMacao SAR, ChinaMacedonia, FYRMadagascarMalawiMalaysiaMaldivesMaliMaltaMarshall IslandsMauritaniaMauritiusMexicoMiddle East & North AfricaMiddle East & North Africa (excluding high income)Middle East & North Africa (IDA & IBRD countries)Middle incomeMoldovaMongoliaMontenegroMoroccoMozambiqueMyanmarNamibiaNauruNepalNetherlandsNicaraguaNigerNorwayOECD membersOmanOther small statesPacific island small statesPakistanPalauPanamaPapua New GuineaParaguayPeruPhilippinesPolandPortugalPost-demographic dividendPre-demographic dividendQatarRomaniaRussian FederationRwandaSamoaSan MarinoSao Tome and PrincipeSaudi ArabiaSenegalSerbiaSeychellesSierra LeoneSlovak RepublicSloveniaSmall statesSolomon IslandsSouth AfricaSouth AsiaSouth Asia (IDA & IBRD)South SudanSpainSri LankaSt. Kitts and NevisSt. LuciaSt. Vincent and the GrenadinesSub-Saharan Africa Sub-Saharan Africa (excluding high income)Sub-Saharan Africa (IDA & IBRD countries)SudanSurinameSwazilandSwedenSwitzerlandSyrian Arab RepublicTajikistanTanzaniaThailandTimor-LesteTogoTongaTrinidad and TobagoTunisiaTurkeyTuvaluUgandaUkraineUnited Arab EmiratesUpper middle incomeUruguayUzbekistanVanuatuVenezuela, RBVietnamWest Bank and GazaWorldYemen, Rep.ZambiaZimbabwe Linea del tempo:
Questa scala temporale mostra un grafico dal 1971 anno al 2015 anno. Fragile and conflict affected situations. I dati fino ad 1970 anno non disponibili. Il numero di osservazioni attuali secondo i date: 45.
La fonte (nome):
Indicatori dello sviluppo mondiale
La fonte (organizzazione):
United Nations Educational, Scientific, and Cultural Organization (UNESCO) Institute for Statistics.
Categorie:
Education
sono stati aggiornati
23 apr 2017 anni
Indicatori delle variazioni dei valori per anni
Minima:
19.908
1 gen 1972 anni
Massimo:
43.003
1 gen 2015 anni
Alla data di osservazione
Valore
Variazione assoluta
La variazione rispetto al valore precedente
1 gen 1971 anni
19.909
+19.909
0.0%
1 gen 1972 anni
19.908
-0.001
-0.01%
1 gen 1973 anni
20.722
+0.814
4.09%
1 gen 1974 anni
21.454
+0.732
3.53%
1 gen 1975 anni
21.088
-0.366
-1.7%
1 gen 1976 anni
21.799
+0.71
3.37%
1 gen 1977 anni
22.043
+0.244
1.12%
1 gen 1978 anni
22.35
+0.307
1.39%
1 gen 1979 anni
23.214
+0.865
3.87%
1 gen 1980 anni
23.91
+0.696
3.0%
1 gen 1981 anni
24.366
+0.456
1.91%
1 gen 1982 anni
24.778
+0.412
1.69%
1 gen 1983 anni
24.536
-0.241
-0.97%
1 gen 1984 anni
24.73
+0.194
0.79%
1 gen 1985 anni
25.123
+0.392
1.59%
1 gen 1986 anni
25.51
+0.387
1.54%
1 gen 1987 anni
25.742
+0.233
0.91%
1 gen 1988 anni
25.595
-0.147
-0.57%
1 gen 1989 anni
25.881
+0.286
1.12%
1 gen 1990 anni
25.863
-0.018
-0.07%
1 gen 1991 anni
25.839
-0.025
-0.1%
1 gen 1992 anni
26.056
+0.218
0.84%
1 gen 1993 anni
26.273
+0.217
0.83%
1 gen 1994 anni
26.575
+0.302
1.15%
1 gen 1995 anni
27.235
+0.66
2.48%
1 gen 1996 anni
27.766
+0.531
1.95%
1 gen 1997 anni
28.203
+0.437
1.57%
1 gen 1998 anni
28.786
+0.583
2.07%
1 gen 1999 anni
29.387
+0.601
2.09%
1 gen 2000 anni
29.93
+0.542
1.85%
1 gen 2001 anni
31.217
+1.287
4.3%
1 gen 2002 anni
32.131
+0.915
2.93%
1 gen 2003 anni
33.162
+1.031
3.21%
1 gen 2004 anni
34.289
+1.127
3.4%
1 gen 2005 anni
36.065
+1.776
5.18%
1 gen 2006 anni
36.835
+0.77
2.13%
1 gen 2007 anni
37.532
+0.697
1.89%
1 gen 2008 anni
37.961
+0.429
1.14%
1 gen 2009 anni
39.305
+1.344
3.54%
1 gen 2010 anni
40.234
+0.928
2.36%
1 gen 2011 anni
40.494
+0.261
0.65%
1 gen 2012 anni
41.133
+0.639
1.58%
1 gen 2013 anni
41.746
+0.613
1.49%
1 gen 2014 anni
41.594
-0.152
-0.36%
1 gen 2015 anni
43.003
+1.409
3.39%
Classificazione dei paesi secondo i statistiche attuali per anni


Commenti: