29
/it/
it
AIzaSyAYiBZKx7MnpbEhh9jyipgxe19OcubqV5w
April 1, 2024
24267
Arab World
ARB
false
2
1
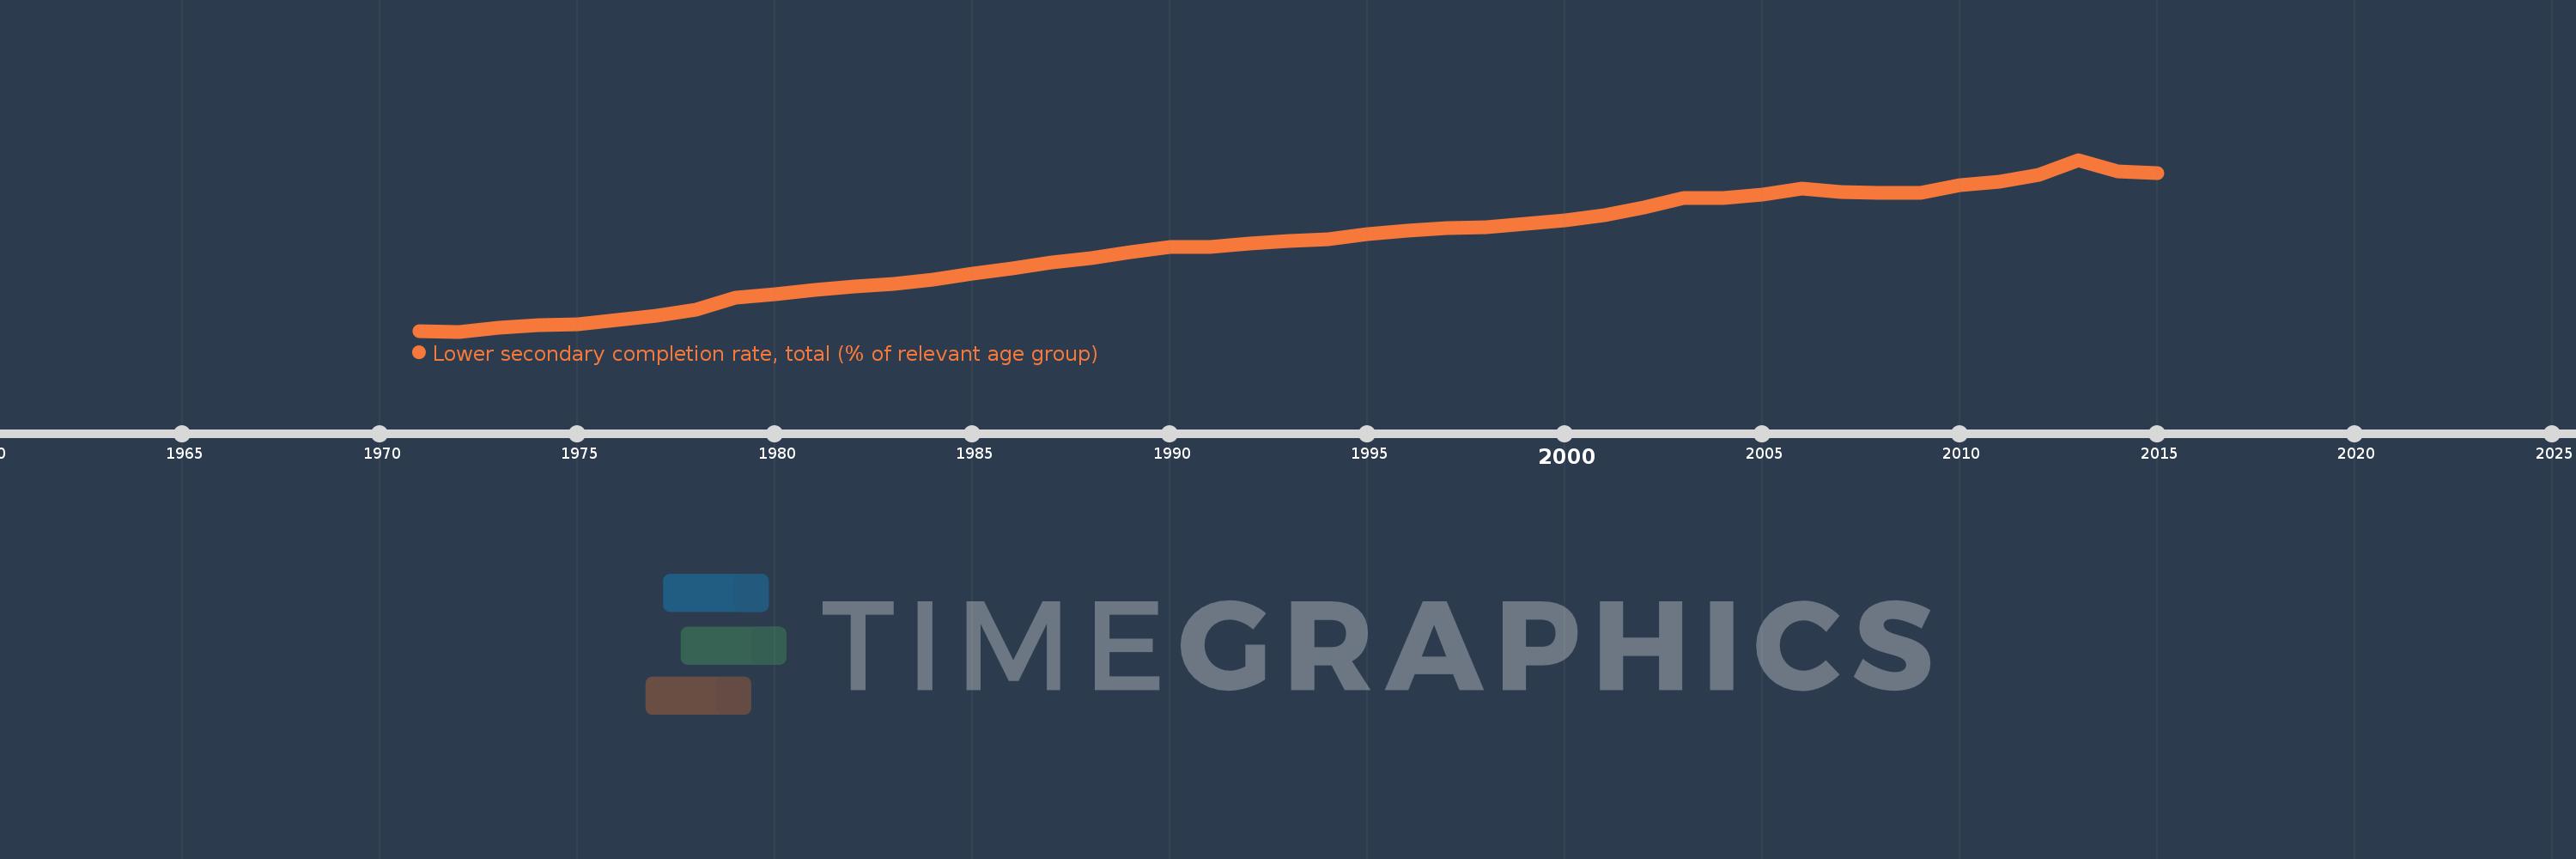
Lower secondary completion rate, total (% of relevant age group)
2015,2014,2013,2012,2011,2010,2009,2008,2007,2006,2005,2004,2003,2002,2001,2000,1999,1998,1997,1996,1995,1994,1993,1992,1991,1990,1989,1988,1987,1986,1985,1984,1983,1982,1981,1980,1979,1978,1977,1976,1975,1974,1973,1972,1971
Queste statistiche in altri paesi:
AfghanistanAlbaniaAlgeriaAngolaAntigua and BarbudaArab WorldArgentinaArmeniaArubaAustriaAzerbaijanBahamas, TheBahrainBangladeshBarbadosBelarusBelgiumBelizeBeninBermudaBhutanBoliviaBosnia and HerzegovinaBotswanaBrazilBritish Virgin IslandsBrunei DarussalamBulgariaBurkina FasoBurundiCabo VerdeCambodiaCameroonCaribbean small statesCentral African RepublicCentral Europe and the BalticsChadChileChinaColombiaComorosCongo, Dem. Rep.Congo, Rep.Costa RicaCote d'IvoireCroatiaCubaCyprusCzech RepublicDenmarkDjiboutiDominicaDominican RepublicEarly-demographic dividendEast Asia & PacificEast Asia & Pacific (excluding high income)East Asia & Pacific (IDA & IBRD countries)EcuadorEgypt, Arab Rep.El SalvadorEquatorial GuineaEritreaEstoniaEthiopiaEuro areaEurope & Central AsiaEurope & Central Asia (excluding high income)Europe & Central Asia (IDA & IBRD countries)European UnionFijiFinlandFragile and conflict affected situationsFranceGabonGambia, TheGeorgiaGermanyGhanaGreeceGrenadaGuatemalaGuineaGuinea-BissauGuyanaHaitiHeavily indebted poor countries (HIPC)High incomeHondurasHong Kong SAR, ChinaHungaryIBRD onlyIcelandIDA & IBRD totalIDA blendIDA onlyIDA totalIndiaIndonesiaIran, Islamic Rep.IraqIrelandIsraelItalyJamaicaJapanJordanKazakhstanKenyaKiribatiKorea, Dem. People’s Rep.Korea, Rep.KuwaitKyrgyz RepublicLao PDRLate-demographic dividendLatin America & Caribbean Latin America & Caribbean (excluding high income)Latin America & the Caribbean (IDA & IBRD countries)LatviaLeast developed countries: UN classificationLebanonLesothoLiberiaLiechtensteinLithuaniaLow & middle incomeLow incomeLower middle incomeLuxembourgMacao SAR, ChinaMacedonia, FYRMadagascarMalawiMalaysiaMaldivesMaliMaltaMarshall IslandsMauritaniaMauritiusMexicoMiddle East & North AfricaMiddle East & North Africa (excluding high income)Middle East & North Africa (IDA & IBRD countries)Middle incomeMoldovaMongoliaMontenegroMoroccoMozambiqueMyanmarNamibiaNauruNepalNetherlandsNicaraguaNigerNorwayOECD membersOmanOther small statesPacific island small statesPakistanPalauPanamaPapua New GuineaParaguayPeruPhilippinesPolandPortugalPost-demographic dividendPre-demographic dividendQatarRomaniaRussian FederationRwandaSamoaSan MarinoSao Tome and PrincipeSaudi ArabiaSenegalSerbiaSeychellesSierra LeoneSlovak RepublicSloveniaSmall statesSolomon IslandsSouth AfricaSouth AsiaSouth Asia (IDA & IBRD)South SudanSpainSri LankaSt. Kitts and NevisSt. LuciaSt. Vincent and the GrenadinesSub-Saharan Africa Sub-Saharan Africa (excluding high income)Sub-Saharan Africa (IDA & IBRD countries)SudanSurinameSwazilandSwedenSwitzerlandSyrian Arab RepublicTajikistanTanzaniaThailandTimor-LesteTogoTongaTrinidad and TobagoTunisiaTurkeyTuvaluUgandaUkraineUnited Arab EmiratesUpper middle incomeUruguayUzbekistanVanuatuVenezuela, RBVietnamWest Bank and GazaWorldYemen, Rep.ZambiaZimbabwe Linea del tempo:
Questa scala temporale mostra un grafico dal 1971 anno al 2015 anno. Arab World. I dati fino ad 1970 anno non disponibili. Il numero di osservazioni attuali secondo i date: 45.
La fonte (nome):
Indicatori dello sviluppo mondiale
La fonte (organizzazione):
United Nations Educational, Scientific, and Cultural Organization (UNESCO) Institute for Statistics.
Categorie:
Education
sono stati aggiornati
23 apr 2017 anni
Indicatori delle variazioni dei valori per anni
Minima:
27.071
1 gen 1972 anni
Massimo:
70.294
1 gen 2013 anni
Alla data di osservazione
Valore
Variazione assoluta
La variazione rispetto al valore precedente
1 gen 1971 anni
27.073
+27.073
0.0%
1 gen 1972 anni
27.071
-0.001
0.0%
1 gen 1973 anni
27.982
+0.911
3.37%
1 gen 1974 anni
28.612
+0.629
2.25%
1 gen 1975 anni
28.805
+0.193
0.67%
1 gen 1976 anni
29.993
+1.188
4.12%
1 gen 1977 anni
30.981
+0.988
3.3%
1 gen 1978 anni
32.658
+1.677
5.41%
1 gen 1979 anni
35.641
+2.983
9.13%
1 gen 1980 anni
36.545
+0.904
2.54%
1 gen 1981 anni
37.541
+0.996
2.73%
1 gen 1982 anni
38.353
+0.813
2.16%
1 gen 1983 anni
39.035
+0.682
1.78%
1 gen 1984 anni
40.123
+1.088
2.79%
1 gen 1985 anni
41.743
+1.62
4.04%
1 gen 1986 anni
42.964
+1.221
2.92%
1 gen 1987 anni
44.556
+1.592
3.71%
1 gen 1988 anni
45.464
+0.908
2.04%
1 gen 1989 anni
47.076
+1.611
3.54%
1 gen 1990 anni
48.424
+1.348
2.86%
1 gen 1991 anni
48.443
+0.019
0.04%
1 gen 1992 anni
49.225
+0.782
1.61%
1 gen 1993 anni
49.912
+0.687
1.4%
1 gen 1994 anni
50.331
+0.419
0.84%
1 gen 1995 anni
51.544
+1.213
2.41%
1 gen 1996 anni
52.457
+0.913
1.77%
1 gen 1997 anni
53.145
+0.688
1.31%
1 gen 1998 anni
53.253
+0.108
0.2%
1 gen 1999 anni
54.141
+0.888
1.67%
1 gen 2000 anni
55.081
+0.94
1.74%
1 gen 2001 anni
56.26
+1.179
2.14%
1 gen 2002 anni
58.277
+2.016
3.58%
1 gen 2003 anni
60.584
+2.307
3.96%
1 gen 2004 anni
60.689
+0.106
0.17%
1 gen 2005 anni
61.47
+0.781
1.29%
1 gen 2006 anni
62.97
+1.5
2.44%
1 gen 2007 anni
62.117
-0.853
-1.35%
1 gen 2008 anni
62.029
-0.088
-0.14%
1 gen 2009 anni
62.06
+0.031
0.05%
1 gen 2010 anni
63.887
+1.828
2.95%
1 gen 2011 anni
64.701
+0.814
1.27%
1 gen 2012 anni
66.572
+1.871
2.89%
1 gen 2013 anni
70.294
+3.722
5.59%
1 gen 2014 anni
67.429
-2.865
-4.08%
1 gen 2015 anni
66.965
-0.464
-0.69%
Classificazione dei paesi secondo i statistiche attuali per anni


Commenti: