29
/it/
it
AIzaSyAYiBZKx7MnpbEhh9jyipgxe19OcubqV5w
April 1, 2024
32275
Europe & Central Asia (excluding high income)
ECA
false
2
1
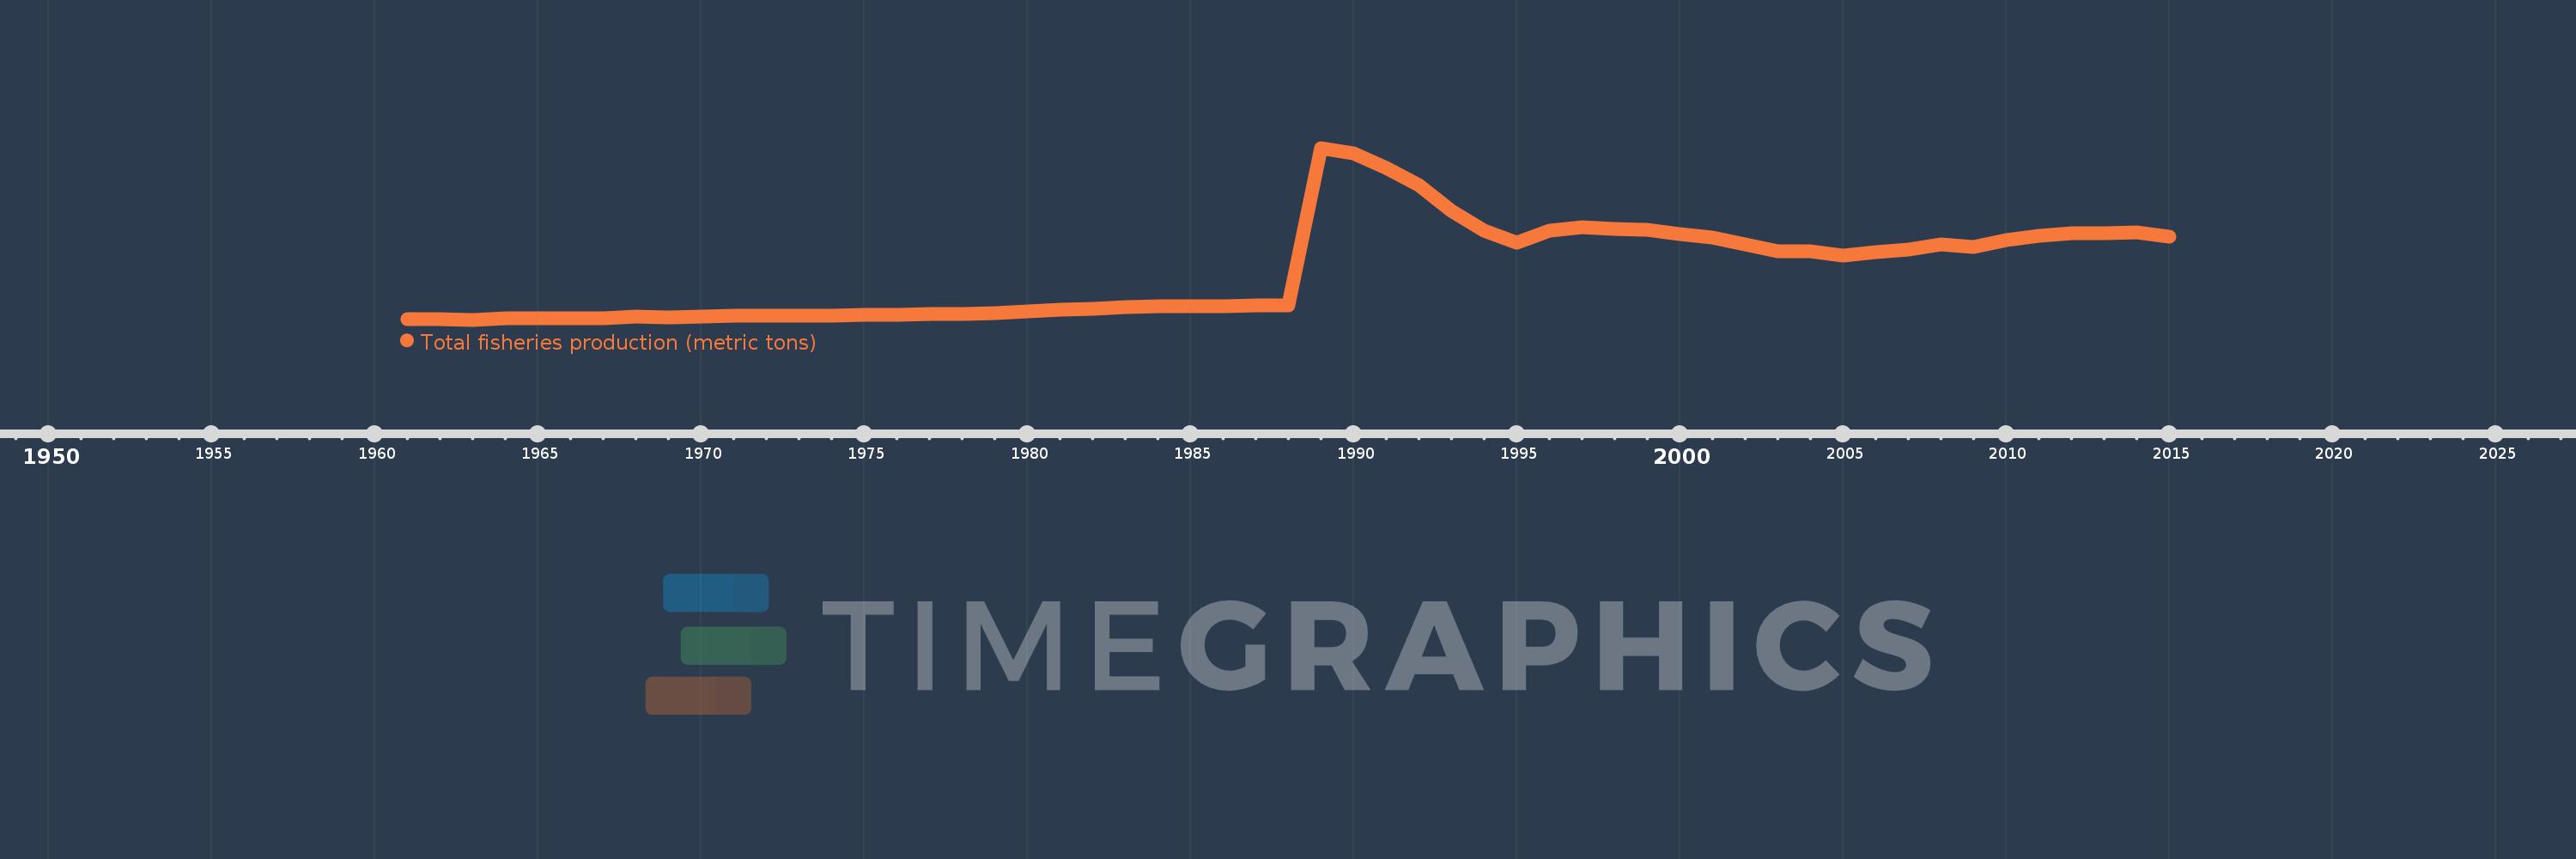
Total fisheries production (metric tons)
2015,2014,2013,2012,2011,2010,2009,2008,2007,2006,2005,2004,2003,2002,2001,2000,1999,1998,1997,1996,1995,1994,1993,1992,1991,1990,1989,1988,1987,1986,1985,1984,1983,1982,1981,1980,1979,1978,1977,1976,1975,1974,1973,1972,1971,1970,1969,1968,1967,1966,1965,1964,1963,1962,1961
Queste statistiche in altri paesi:
AfghanistanAlbaniaAlgeriaAmerican SamoaAngolaAntigua and BarbudaArab WorldArgentinaArmeniaArubaAustraliaAustriaAzerbaijanBahamas, TheBahrainBangladeshBarbadosBelarusBelgiumBelizeBeninBermudaBhutanBoliviaBosnia and HerzegovinaBotswanaBrazilBritish Virgin IslandsBrunei DarussalamBulgariaBurkina FasoBurundiCabo VerdeCambodiaCameroonCanadaCaribbean small statesCayman IslandsCentral African RepublicCentral Europe and the BalticsChadChannel IslandsChileChinaColombiaComorosCongo, Dem. Rep.Congo, Rep.Costa RicaCote d'IvoireCroatiaCubaCuracaoCyprusCzech RepublicDenmarkDjiboutiDominicaDominican RepublicEarly-demographic dividendEast Asia & PacificEast Asia & Pacific (excluding high income)East Asia & Pacific (IDA & IBRD countries)EcuadorEgypt, Arab Rep.El SalvadorEquatorial GuineaEritreaEstoniaEthiopiaEuro areaEurope & Central AsiaEurope & Central Asia (excluding high income)Europe & Central Asia (IDA & IBRD countries)European UnionFaroe IslandsFijiFinlandFragile and conflict affected situationsFranceFrench PolynesiaGabonGambia, TheGeorgiaGermanyGhanaGreeceGreenlandGrenadaGuamGuatemalaGuineaGuinea-BissauGuyanaHaitiHeavily indebted poor countries (HIPC)High incomeHondurasHong Kong SAR, ChinaHungaryIBRD onlyIcelandIDA & IBRD totalIDA blendIDA onlyIDA totalIndiaIndonesiaIran, Islamic Rep.IraqIrelandIsle of ManIsraelItalyJamaicaJapanJordanKazakhstanKenyaKiribatiKorea, Dem. People’s Rep.Korea, Rep.KuwaitKyrgyz RepublicLao PDRLate-demographic dividendLatin America & Caribbean Latin America & Caribbean (excluding high income)Latin America & the Caribbean (IDA & IBRD countries)LatviaLeast developed countries: UN classificationLebanonLesothoLiberiaLibyaLithuaniaLow & middle incomeLow incomeLower middle incomeMacao SAR, ChinaMacedonia, FYRMadagascarMalawiMalaysiaMaldivesMaliMaltaMarshall IslandsMauritaniaMauritiusMexicoMicronesia, Fed. Sts.Middle East & North AfricaMiddle East & North Africa (excluding high income)Middle East & North Africa (IDA & IBRD countries)Middle incomeMoldovaMonacoMongoliaMontenegroMoroccoMozambiqueMyanmarNamibiaNauruNepalNetherlandsNew CaledoniaNew ZealandNicaraguaNigerNigeriaNorth AmericaNorthern Mariana IslandsNorwayOECD membersOmanOther small statesPacific island small statesPakistanPalauPanamaPapua New GuineaParaguayPeruPhilippinesPolandPortugalPost-demographic dividendPre-demographic dividendPuerto RicoQatarRomaniaRussian FederationRwandaSamoaSao Tome and PrincipeSaudi ArabiaSenegalSerbiaSeychellesSierra LeoneSingaporeSint Maarten (Dutch part)Slovak RepublicSloveniaSmall statesSolomon IslandsSomaliaSouth AfricaSouth AsiaSouth Asia (IDA & IBRD)South SudanSpainSri LankaSt. Kitts and NevisSt. LuciaSt. Martin (French part)St. Vincent and the GrenadinesSub-Saharan Africa Sub-Saharan Africa (excluding high income)Sub-Saharan Africa (IDA & IBRD countries)SudanSurinameSwazilandSwedenSwitzerlandSyrian Arab RepublicTajikistanTanzaniaThailandTimor-LesteTogoTongaTrinidad and TobagoTunisiaTurkeyTurkmenistanTurks and Caicos IslandsTuvaluUgandaUkraineUnited Arab EmiratesUnited KingdomUnited StatesUpper middle incomeUruguayUzbekistanVanuatuVenezuela, RBVietnamVirgin Islands (U.S.)West Bank and GazaWorldYemen, Rep.ZambiaZimbabwe Linea del tempo:
Questa scala temporale mostra un grafico dal 1961 anno al 2015 anno. Europe & Central Asia (excluding high income). I dati fino ad 1960 anno non disponibili. Il numero di osservazioni attuali secondo i date: 55.
La fonte (nome):
Indicatori dello sviluppo mondiale
La fonte (organizzazione):
Food and Agriculture Organization.
Categorie:
Environment
sono stati aggiornati
23 apr 2017 anni
Indicatori delle variazioni dei valori per anni
Minima:
106.0 Mille.
1 gen 1963 anni
Massimo:
10.78 Mln
1 gen 1989 anni
Alla data di osservazione
Valore
Variazione assoluta
La variazione rispetto al valore precedente
1 gen 1961 anni
137.16 Mille.
+137.16 Mille.
0.0%
1 gen 1962 anni
131.38 Mille.
-5.78 Mille.
-4.21%
1 gen 1963 anni
106.0 Mille.
-25.38 Mille.
-19.32%
1 gen 1964 anni
177.02 Mille.
+71.02 Mille.
67.0%
1 gen 1965 anni
171.85 Mille.
-5.17 Mille.
-2.92%
1 gen 1966 anni
197.344 Mille.
+25.494 Mille.
14.84%
1 gen 1967 anni
185.364 Mille.
-11.98 Mille.
-6.07%
1 gen 1968 anni
286.61 Mille.
+101.246 Mille.
54.62%
1 gen 1969 anni
241.954 Mille.
-44.656 Mille.
-15.58%
1 gen 1970 anni
307.05 Mille.
+65.096 Mille.
26.9%
1 gen 1971 anni
339.251 Mille.
+32.201 Mille.
10.49%
1 gen 1972 anni
341.836 Mille.
+2.585 Mille.
0.76%
1 gen 1973 anni
378.793 Mille.
+36.957 Mille.
10.81%
1 gen 1974 anni
359.052 Mille.
-19.741 Mille.
-5.21%
1 gen 1975 anni
385.93 Mille.
+26.878 Mille.
7.49%
1 gen 1976 anni
425.739 Mille.
+39.809 Mille.
10.32%
1 gen 1977 anni
456.361 Mille.
+30.622 Mille.
7.19%
1 gen 1978 anni
462.633 Mille.
+6.272 Mille.
1.37%
1 gen 1979 anni
490.925 Mille.
+28.292 Mille.
6.12%
1 gen 1980 anni
625.096 Mille.
+134.171 Mille.
27.33%
1 gen 1981 anni
736.018 Mille.
+110.922 Mille.
17.74%
1 gen 1982 anni
779.782 Mille.
+43.764 Mille.
5.95%
1 gen 1983 anni
865.988 Mille.
+86.206 Mille.
11.06%
1 gen 1984 anni
932.852 Mille.
+66.864 Mille.
7.72%
1 gen 1985 anni
925.19 Mille.
-7.662 Mille.
-0.82%
1 gen 1986 anni
930.041 Mille.
+4.851 Mille.
0.52%
1 gen 1987 anni
975.431 Mille.
+45.39 Mille.
4.88%
1 gen 1988 anni
1.017 Mln
+41.724 Mille.
4.28%
1 gen 1989 anni
10.78 Mln
+9.763 Mln
959.86%
1 gen 1990 anni
10.447 Mln
-332.919 Mille.
-3.09%
1 gen 1991 anni
9.546 Mln
-901.914 Mille.
-8.63%
1 gen 1992 anni
8.45 Mln
-1.096 Mln
-11.48%
1 gen 1993 anni
6.885 Mln
-1.565 Mln
-18.52%
1 gen 1994 anni
5.615 Mln
-1.271 Mln
-18.45%
1 gen 1995 anni
4.896 Mln
-718.404 Mille.
-12.8%
1 gen 1996 anni
5.655 Mln
+758.976 Mille.
15.5%
1 gen 1997 anni
5.873 Mln
+218.177 Mille.
3.86%
1 gen 1998 anni
5.76 Mln
-113.83 Mille.
-1.94%
1 gen 1999 anni
5.691 Mln
-68.186 Mille.
-1.18%
1 gen 2000 anni
5.445 Mln
-246.48 Mille.
-4.33%
1 gen 2001 anni
5.235 Mln
-209.588 Mille.
-3.85%
1 gen 2002 anni
4.767 Mln
-468.012 Mille.
-8.94%
1 gen 2003 anni
4.384 Mln
-383.592 Mille.
-8.05%
1 gen 2004 anni
4.386 Mln
+2.235 Mille.
0.05%
1 gen 2005 anni
4.082 Mln
-304.175 Mille.
-6.94%
1 gen 2006 anni
4.296 Mln
+213.715 Mille.
5.24%
1 gen 2007 anni
4.444 Mln
+148.418 Mille.
3.46%
1 gen 2008 anni
4.795 Mln
+351.173 Mille.
7.9%
1 gen 2009 anni
4.632 Mln
-163.057 Mille.
-3.4%
1 gen 2010 anni
5.029 Mln
+396.716 Mille.
8.56%
1 gen 2011 anni
5.301 Mln
+271.797 Mille.
5.4%
1 gen 2012 anni
5.486 Mln
+185.628 Mille.
3.5%
1 gen 2013 anni
5.493 Mln
+6.581 Mille.
0.12%
1 gen 2014 anni
5.551 Mln
+57.759 Mille.
1.05%
1 gen 2015 anni
5.288 Mln
-262.059 Mille.
-4.72%
Classificazione dei paesi secondo i statistiche attuali per anni


Commenti: