29
/it/
it
AIzaSyAYiBZKx7MnpbEhh9jyipgxe19OcubqV5w
April 1, 2024
188576
Malaysia
MYS
true
2
1
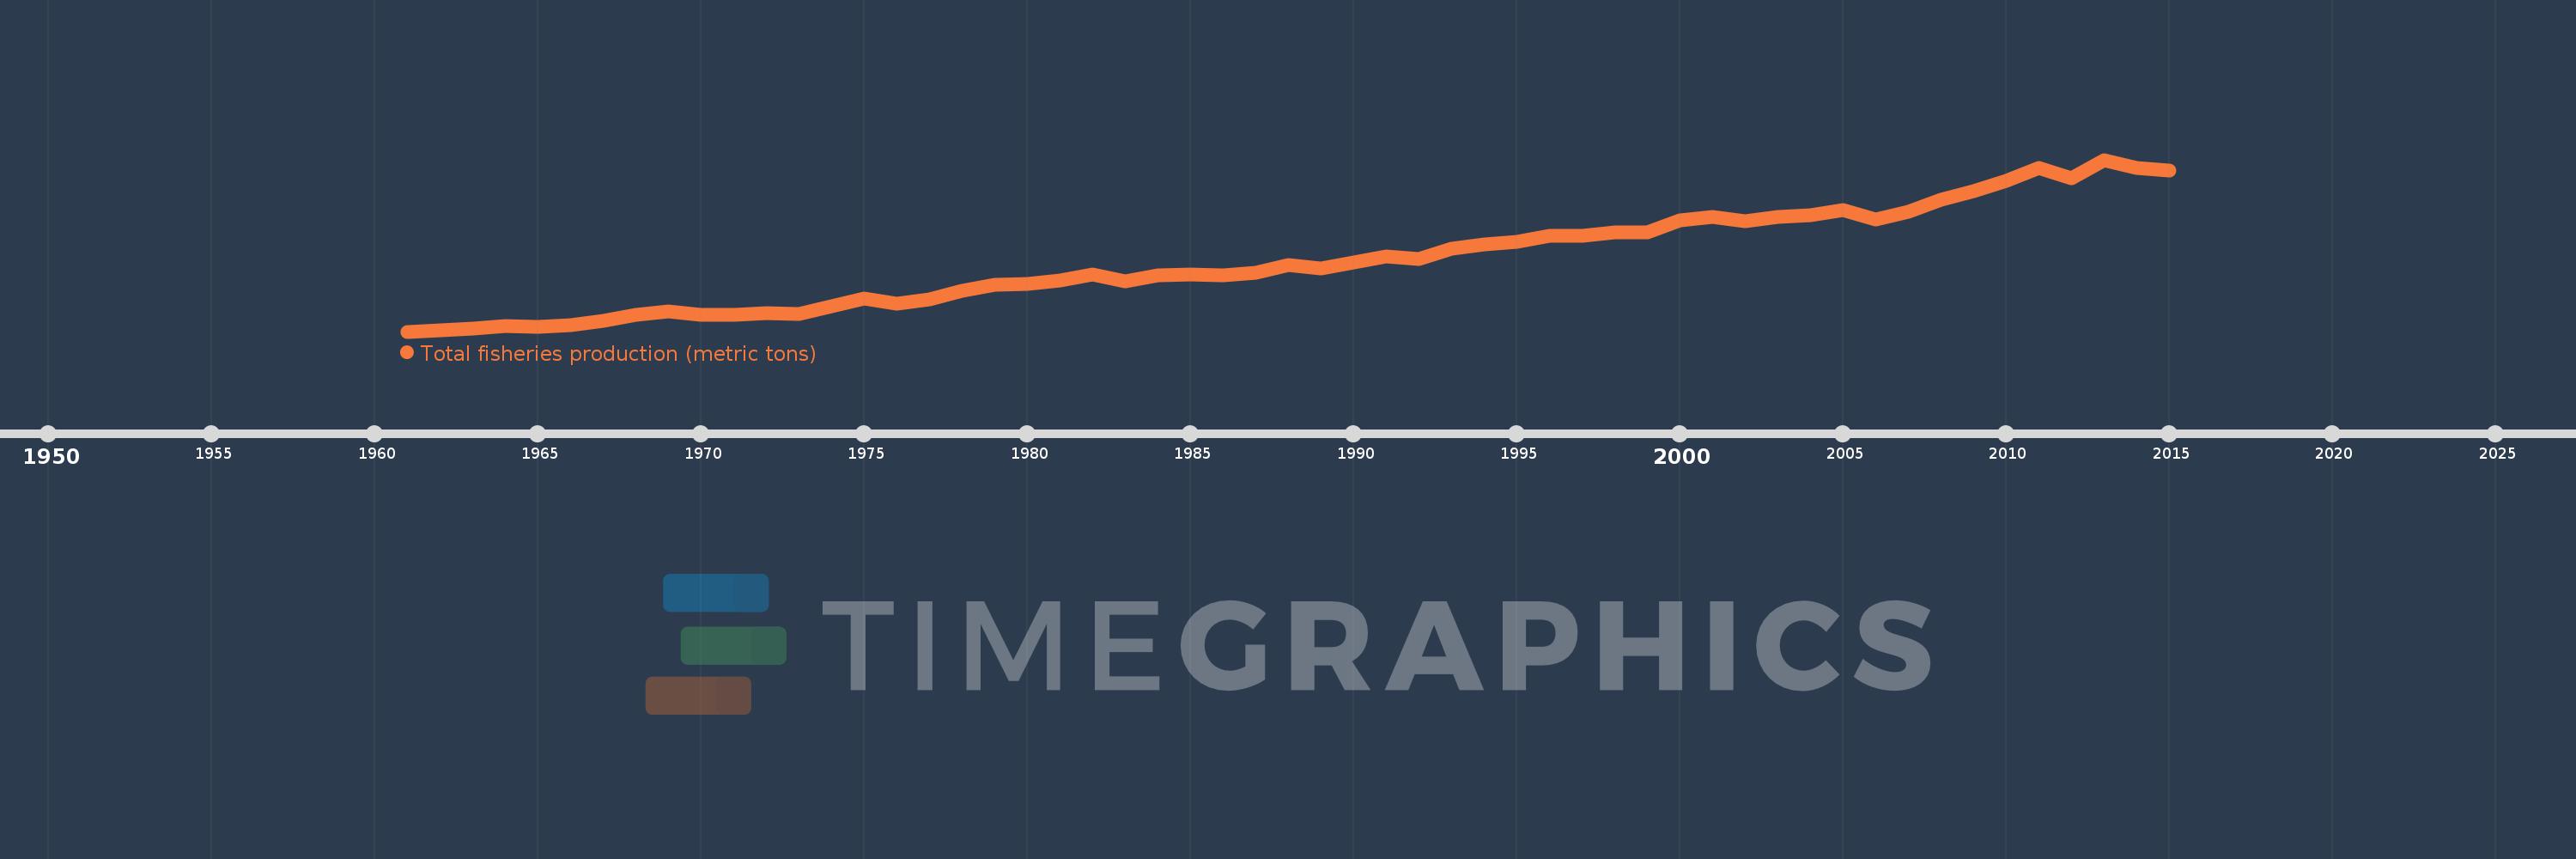
Total fisheries production (metric tons)
2015,2014,2013,2012,2011,2010,2009,2008,2007,2006,2005,2004,2003,2002,2001,2000,1999,1998,1997,1996,1995,1994,1993,1992,1991,1990,1989,1988,1987,1986,1985,1984,1983,1982,1981,1980,1979,1978,1977,1976,1975,1974,1973,1972,1971,1970,1969,1968,1967,1966,1965,1964,1963,1962,1961
Queste statistiche in altri paesi:
AfghanistanAlbaniaAlgeriaAmerican SamoaAngolaAntigua and BarbudaArab WorldArgentinaArmeniaArubaAustraliaAustriaAzerbaijanBahamas, TheBahrainBangladeshBarbadosBelarusBelgiumBelizeBeninBermudaBhutanBoliviaBosnia and HerzegovinaBotswanaBrazilBritish Virgin IslandsBrunei DarussalamBulgariaBurkina FasoBurundiCabo VerdeCambodiaCameroonCanadaCaribbean small statesCayman IslandsCentral African RepublicCentral Europe and the BalticsChadChannel IslandsChileChinaColombiaComorosCongo, Dem. Rep.Congo, Rep.Costa RicaCote d'IvoireCroatiaCubaCuracaoCyprusCzech RepublicDenmarkDjiboutiDominicaDominican RepublicEarly-demographic dividendEast Asia & PacificEast Asia & Pacific (excluding high income)East Asia & Pacific (IDA & IBRD countries)EcuadorEgypt, Arab Rep.El SalvadorEquatorial GuineaEritreaEstoniaEthiopiaEuro areaEurope & Central AsiaEurope & Central Asia (excluding high income)Europe & Central Asia (IDA & IBRD countries)European UnionFaroe IslandsFijiFinlandFragile and conflict affected situationsFranceFrench PolynesiaGabonGambia, TheGeorgiaGermanyGhanaGreeceGreenlandGrenadaGuamGuatemalaGuineaGuinea-BissauGuyanaHaitiHeavily indebted poor countries (HIPC)High incomeHondurasHong Kong SAR, ChinaHungaryIBRD onlyIcelandIDA & IBRD totalIDA blendIDA onlyIDA totalIndiaIndonesiaIran, Islamic Rep.IraqIrelandIsle of ManIsraelItalyJamaicaJapanJordanKazakhstanKenyaKiribatiKorea, Dem. People’s Rep.Korea, Rep.KuwaitKyrgyz RepublicLao PDRLate-demographic dividendLatin America & Caribbean Latin America & Caribbean (excluding high income)Latin America & the Caribbean (IDA & IBRD countries)LatviaLeast developed countries: UN classificationLebanonLesothoLiberiaLibyaLithuaniaLow & middle incomeLow incomeLower middle incomeMacao SAR, ChinaMacedonia, FYRMadagascarMalawiMalaysiaMaldivesMaliMaltaMarshall IslandsMauritaniaMauritiusMexicoMicronesia, Fed. Sts.Middle East & North AfricaMiddle East & North Africa (excluding high income)Middle East & North Africa (IDA & IBRD countries)Middle incomeMoldovaMonacoMongoliaMontenegroMoroccoMozambiqueMyanmarNamibiaNauruNepalNetherlandsNew CaledoniaNew ZealandNicaraguaNigerNigeriaNorth AmericaNorthern Mariana IslandsNorwayOECD membersOmanOther small statesPacific island small statesPakistanPalauPanamaPapua New GuineaParaguayPeruPhilippinesPolandPortugalPost-demographic dividendPre-demographic dividendPuerto RicoQatarRomaniaRussian FederationRwandaSamoaSao Tome and PrincipeSaudi ArabiaSenegalSerbiaSeychellesSierra LeoneSingaporeSint Maarten (Dutch part)Slovak RepublicSloveniaSmall statesSolomon IslandsSomaliaSouth AfricaSouth AsiaSouth Asia (IDA & IBRD)South SudanSpainSri LankaSt. Kitts and NevisSt. LuciaSt. Martin (French part)St. Vincent and the GrenadinesSub-Saharan Africa Sub-Saharan Africa (excluding high income)Sub-Saharan Africa (IDA & IBRD countries)SudanSurinameSwazilandSwedenSwitzerlandSyrian Arab RepublicTajikistanTanzaniaThailandTimor-LesteTogoTongaTrinidad and TobagoTunisiaTurkeyTurkmenistanTurks and Caicos IslandsTuvaluUgandaUkraineUnited Arab EmiratesUnited KingdomUnited StatesUpper middle incomeUruguayUzbekistanVanuatuVenezuela, RBVietnamVirgin Islands (U.S.)West Bank and GazaWorldYemen, Rep.ZambiaZimbabwe Linea del tempo:
Questa scala temporale mostra un grafico dal 1961 anno al 2015 anno. Malaysia. I dati fino ad 1960 anno non disponibili. Il numero di osservazioni attuali secondo i date: 55.
La fonte (nome):
Indicatori dello sviluppo mondiale
La fonte (organizzazione):
Food and Agriculture Organization.
Categorie:
Environment
sono stati aggiornati
23 apr 2017 anni
Indicatori delle variazioni dei valori per anni
Minima:
155.941 Mille.
1 gen 1961 anni
Massimo:
2.116 Mln
1 gen 2013 anni
Alla data di osservazione
Valore
Variazione assoluta
La variazione rispetto al valore precedente
1 gen 1961 anni
155.941 Mille.
+155.941 Mille.
0.0%
1 gen 1962 anni
168.311 Mille.
+12.37 Mille.
7.93%
1 gen 1963 anni
189.968 Mille.
+21.657 Mille.
12.87%
1 gen 1964 anni
220.441 Mille.
+30.473 Mille.
16.04%
1 gen 1965 anni
214.002 Mille.
-6.439 Mille.
-2.92%
1 gen 1966 anni
230.308 Mille.
+16.306 Mille.
7.62%
1 gen 1967 anni
274.109 Mille.
+43.801 Mille.
19.02%
1 gen 1968 anni
345.011 Mille.
+70.902 Mille.
25.87%
1 gen 1969 anni
383.808 Mille.
+38.797 Mille.
11.25%
1 gen 1970 anni
350.102 Mille.
-33.706 Mille.
-8.78%
1 gen 1971 anni
343.096 Mille.
-7.006 Mille.
-2.0%
1 gen 1972 anni
370.487 Mille.
+27.391 Mille.
7.98%
1 gen 1973 anni
361.478 Mille.
-9.009 Mille.
-2.43%
1 gen 1974 anni
447.367 Mille.
+85.889 Mille.
23.76%
1 gen 1975 anni
528.483 Mille.
+81.116 Mille.
18.13%
1 gen 1976 anni
476.853 Mille.
-51.63 Mille.
-9.77%
1 gen 1977 anni
519.969 Mille.
+43.116 Mille.
9.04%
1 gen 1978 anni
622.609 Mille.
+102.64 Mille.
19.74%
1 gen 1979 anni
688.565 Mille.
+65.956 Mille.
10.59%
1 gen 1980 anni
700.012 Mille.
+11.447 Mille.
1.66%
1 gen 1981 anni
740.4 Mille.
+40.388 Mille.
5.77%
1 gen 1982 anni
808.555 Mille.
+68.155 Mille.
9.21%
1 gen 1983 anni
734.189 Mille.
-74.366 Mille.
-9.2%
1 gen 1984 anni
796.636 Mille.
+62.447 Mille.
8.51%
1 gen 1985 anni
805.406 Mille.
+8.77 Mille.
1.1%
1 gen 1986 anni
801.157 Mille.
-4.249 Mille.
-0.53%
1 gen 1987 anni
827.924 Mille.
+26.767 Mille.
3.34%
1 gen 1988 anni
911.97 Mille.
+84.045 Mille.
10.15%
1 gen 1989 anni
878.705 Mille.
-33.264 Mille.
-3.65%
1 gen 1990 anni
941.82 Mille.
+63.115 Mille.
7.18%
1 gen 1991 anni
1.01 Mln
+67.797 Mille.
7.2%
1 gen 1992 anni
980.563 Mille.
-29.054 Mille.
-2.88%
1 gen 1993 anni
1.106 Mln
+125.676 Mille.
12.82%
1 gen 1994 anni
1.155 Mln
+48.614 Mille.
4.39%
1 gen 1995 anni
1.183 Mln
+27.799 Mille.
2.41%
1 gen 1996 anni
1.25 Mln
+67.308 Mille.
5.69%
1 gen 1997 anni
1.244 Mln
-5.935 Mille.
-0.47%
1 gen 1998 anni
1.285 Mln
+40.971 Mille.
3.29%
1 gen 1999 anni
1.291 Mln
+6.438 Mille.
0.5%
1 gen 2000 anni
1.423 Mln
+131.388 Mille.
10.17%
1 gen 2001 anni
1.461 Mln
+38.401 Mille.
2.7%
1 gen 2002 anni
1.416 Mln
-45.389 Mille.
-3.11%
1 gen 2003 anni
1.464 Mln
+47.791 Mille.
3.38%
1 gen 2004 anni
1.483 Mln
+19.699 Mille.
1.35%
1 gen 2005 anni
1.542 Mln
+58.738 Mille.
3.96%
1 gen 2006 anni
1.434 Mln
-107.965 Mille.
-7.0%
1 gen 2007 anni
1.519 Mln
+84.778 Mille.
5.91%
1 gen 2008 anni
1.658 Mln
+139.416 Mille.
9.18%
1 gen 2009 anni
1.757 Mln
+98.743 Mille.
5.95%
1 gen 2010 anni
1.874 Mln
+117.231 Mille.
6.67%
1 gen 2011 anni
2.019 Mln
+144.435 Mille.
7.71%
1 gen 2012 anni
1.91 Mln
-109.128 Mille.
-5.41%
1 gen 2013 anni
2.116 Mln
+206.665 Mille.
10.82%
1 gen 2014 anni
2.023 Mln
-92.75 Mille.
-4.38%
1 gen 2015 anni
1.989 Mln
-34.322 Mille.
-1.7%
Classificazione dei paesi secondo i statistiche attuali per anni


Commenti: