29
/it/
it
AIzaSyAYiBZKx7MnpbEhh9jyipgxe19OcubqV5w
April 1, 2024
31641
Europe & Central Asia (excluding high income)
ECA
false
2
1
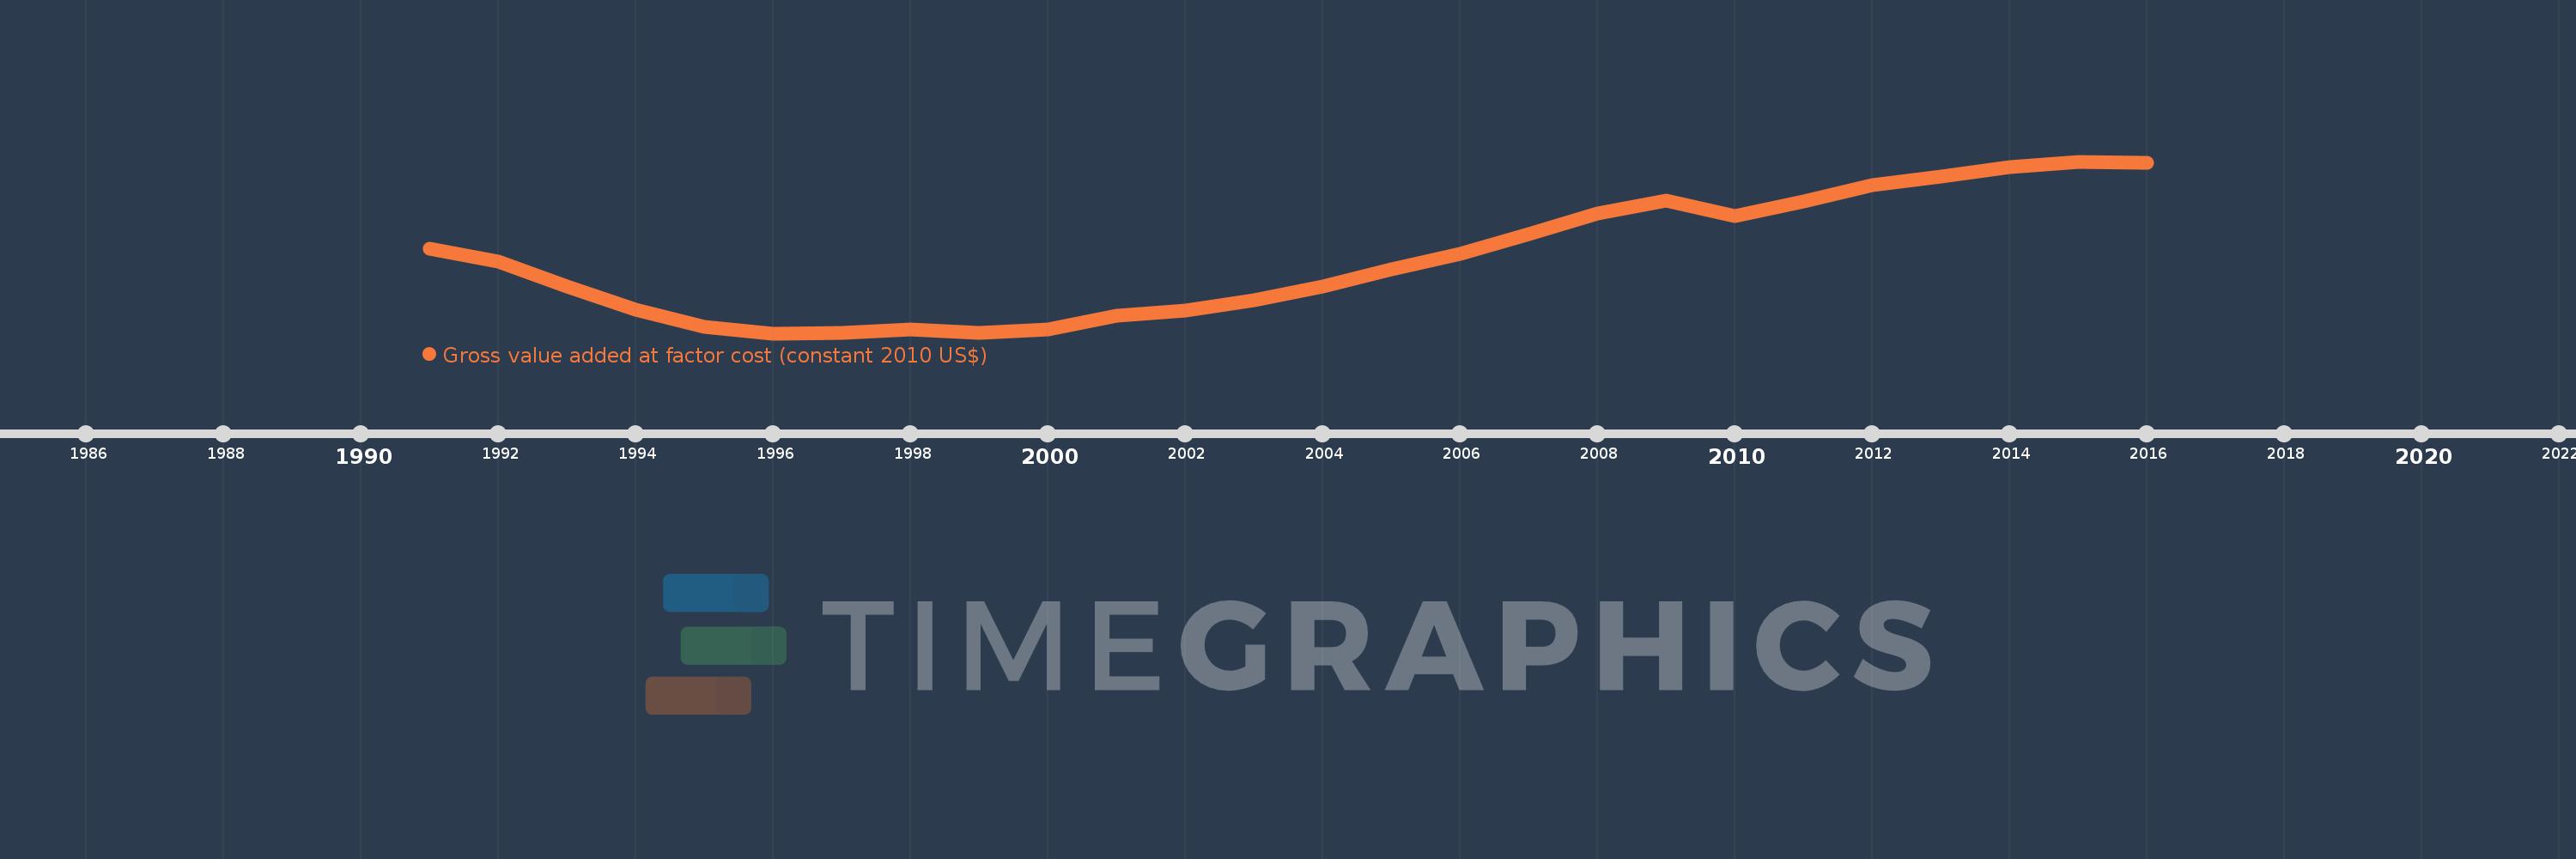
Gross value added at factor cost (constant 2010 US$)
2016,2015,2014,2013,2012,2011,2010,2009,2008,2007,2006,2005,2004,2003,2002,2001,2000,1999,1998,1997,1996,1995,1994,1993,1992,1991
Queste statistiche in altri paesi:
AfghanistanAlbaniaAlgeriaAndorraAntigua and BarbudaArgentinaArmeniaArubaAustraliaAustriaAzerbaijanBahamas, TheBangladeshBarbadosBelarusBelgiumBelizeBeninBermudaBhutanBoliviaBosnia and HerzegovinaBotswanaBrazilBulgariaBurkina FasoBurundiCabo VerdeCambodiaCameroonCanadaCaribbean small statesCentral African RepublicCentral Europe and the BalticsChadChileColombiaCongo, Dem. Rep.Costa RicaCroatiaCubaCyprusCzech RepublicDenmarkDominicaDominican RepublicEarly-demographic dividendEcuadorEgypt, Arab Rep.El SalvadorEquatorial GuineaEstoniaEthiopiaEuro areaEurope & Central AsiaEurope & Central Asia (excluding high income)Europe & Central Asia (IDA & IBRD countries)European UnionFaroe IslandsFijiFinlandFranceGabonGambia, TheGeorgiaGermanyGhanaGreeceGrenadaGuatemalaGuineaGuinea-BissauGuyanaHeavily indebted poor countries (HIPC)High incomeHondurasHong Kong SAR, ChinaHungaryIcelandIDA blendIDA onlyIDA totalIndiaIndonesiaIran, Islamic Rep.IrelandItalyJamaicaJapanJordanKazakhstanKenyaKiribatiKorea, Rep.KosovoKuwaitKyrgyz RepublicLao PDRLatin America & Caribbean Latin America & Caribbean (excluding high income)Latin America & the Caribbean (IDA & IBRD countries)LatviaLeast developed countries: UN classificationLebanonLesothoLiechtensteinLithuaniaLow incomeLower middle incomeLuxembourgMacao SAR, ChinaMacedonia, FYRMadagascarMalawiMaldivesMaliMaltaMarshall IslandsMauritaniaMauritiusMexicoMicronesia, Fed. Sts.Middle East & North Africa (excluding high income)Middle East & North Africa (IDA & IBRD countries)MoldovaMongoliaMontenegroMoroccoMozambiqueNamibiaNepalNetherlandsNew ZealandNicaraguaNigeriaNorth AmericaNorwayOECD membersPacific island small statesPakistanPalauPanamaParaguayPeruPolandPortugalPost-demographic dividendPre-demographic dividendRomaniaRussian FederationRwandaSao Tome and PrincipeSenegalSerbiaSeychellesSierra LeoneSingaporeSlovak RepublicSloveniaSouth AfricaSouth AsiaSouth Asia (IDA & IBRD)SpainSri LankaSt. Kitts and NevisSt. LuciaSt. Vincent and the GrenadinesSub-Saharan Africa Sub-Saharan Africa (excluding high income)Sub-Saharan Africa (IDA & IBRD countries)SudanSurinameSwazilandSwedenSwitzerlandTajikistanTanzaniaThailandTimor-LesteTongaTrinidad and TobagoTunisiaTurkeyTurkmenistanTuvaluUgandaUkraineUnited KingdomUnited StatesUruguayUzbekistanVanuatuVenezuela, RBVietnamWest Bank and GazaWorldZambiaZimbabwe Linea del tempo:
Questa scala temporale mostra un grafico dal 1991 anno al 2016 anno. Europe & Central Asia (excluding high income). I dati fino ad 1990 anno non disponibili. Il numero di osservazioni attuali secondo i date: 26.
La fonte (nome):
Indicatori dello sviluppo mondiale
La fonte (organizzazione):
World Bank national accounts data, and OECD National Accounts data files.
Categorie:
Economy & Growth
sono stati aggiornati
23 apr 2017 anni
Indicatori delle variazioni dei valori per anni
Minima:
1.516 Trln
1 gen 1996 anni
Massimo:
3.038 Trln
1 gen 2015 anni
Alla data di osservazione
Valore
Variazione assoluta
La variazione rispetto al valore precedente
1 gen 1991 anni
2.268 Trln
+2.268 Trln
0.0%
1 gen 1992 anni
2.15 Trln
-118.536 Mlrd
-5.23%
1 gen 1993 anni
1.927 Trln
-222.526 Mlrd
-10.35%
1 gen 1994 anni
1.729 Trln
-198.567 Mlrd
-10.3%
1 gen 1995 anni
1.575 Trln
-154.199 Mlrd
-8.92%
1 gen 1996 anni
1.516 Trln
-58.783 Mlrd
-3.73%
1 gen 1997 anni
1.516 Trln
+251.302 Mln
0.02%
1 gen 1998 anni
1.551 Trln
+34.784 Mlrd
2.29%
1 gen 1999 anni
1.522 Trln
-28.897 Mlrd
-1.86%
1 gen 2000 anni
1.552 Trln
+29.637 Mlrd
1.95%
1 gen 2001 anni
1.67 Trln
+117.991 Mlrd
7.6%
1 gen 2002 anni
1.718 Trln
+48.872 Mlrd
2.93%
1 gen 2003 anni
1.807 Trln
+88.381 Mlrd
5.14%
1 gen 2004 anni
1.927 Trln
+120.701 Mlrd
6.68%
1 gen 2005 anni
2.081 Trln
+153.93 Mlrd
7.99%
1 gen 2006 anni
2.217 Trln
+136.069 Mlrd
6.54%
1 gen 2007 anni
2.398 Trln
+180.345 Mlrd
8.13%
1 gen 2008 anni
2.581 Trln
+183.454 Mlrd
7.65%
1 gen 2009 anni
2.695 Trln
+114.209 Mlrd
4.42%
1 gen 2010 anni
2.556 Trln
-139.577 Mlrd
-5.18%
1 gen 2011 anni
2.688 Trln
+131.624 Mlrd
5.15%
1 gen 2012 anni
2.825 Trln
+137.663 Mlrd
5.12%
1 gen 2013 anni
2.905 Trln
+79.863 Mlrd
2.83%
1 gen 2014 anni
2.987 Trln
+82.058 Mlrd
2.82%
1 gen 2015 anni
3.038 Trln
+50.972 Mlrd
1.71%
1 gen 2016 anni
3.03 Trln
-8.209 Mlrd
-0.27%
Classificazione dei paesi secondo i statistiche attuali per anni


Commenti: