29
/it/
it
AIzaSyAYiBZKx7MnpbEhh9jyipgxe19OcubqV5w
April 1, 2024
30735
Europe & Central Asia
ECS
false
2
1
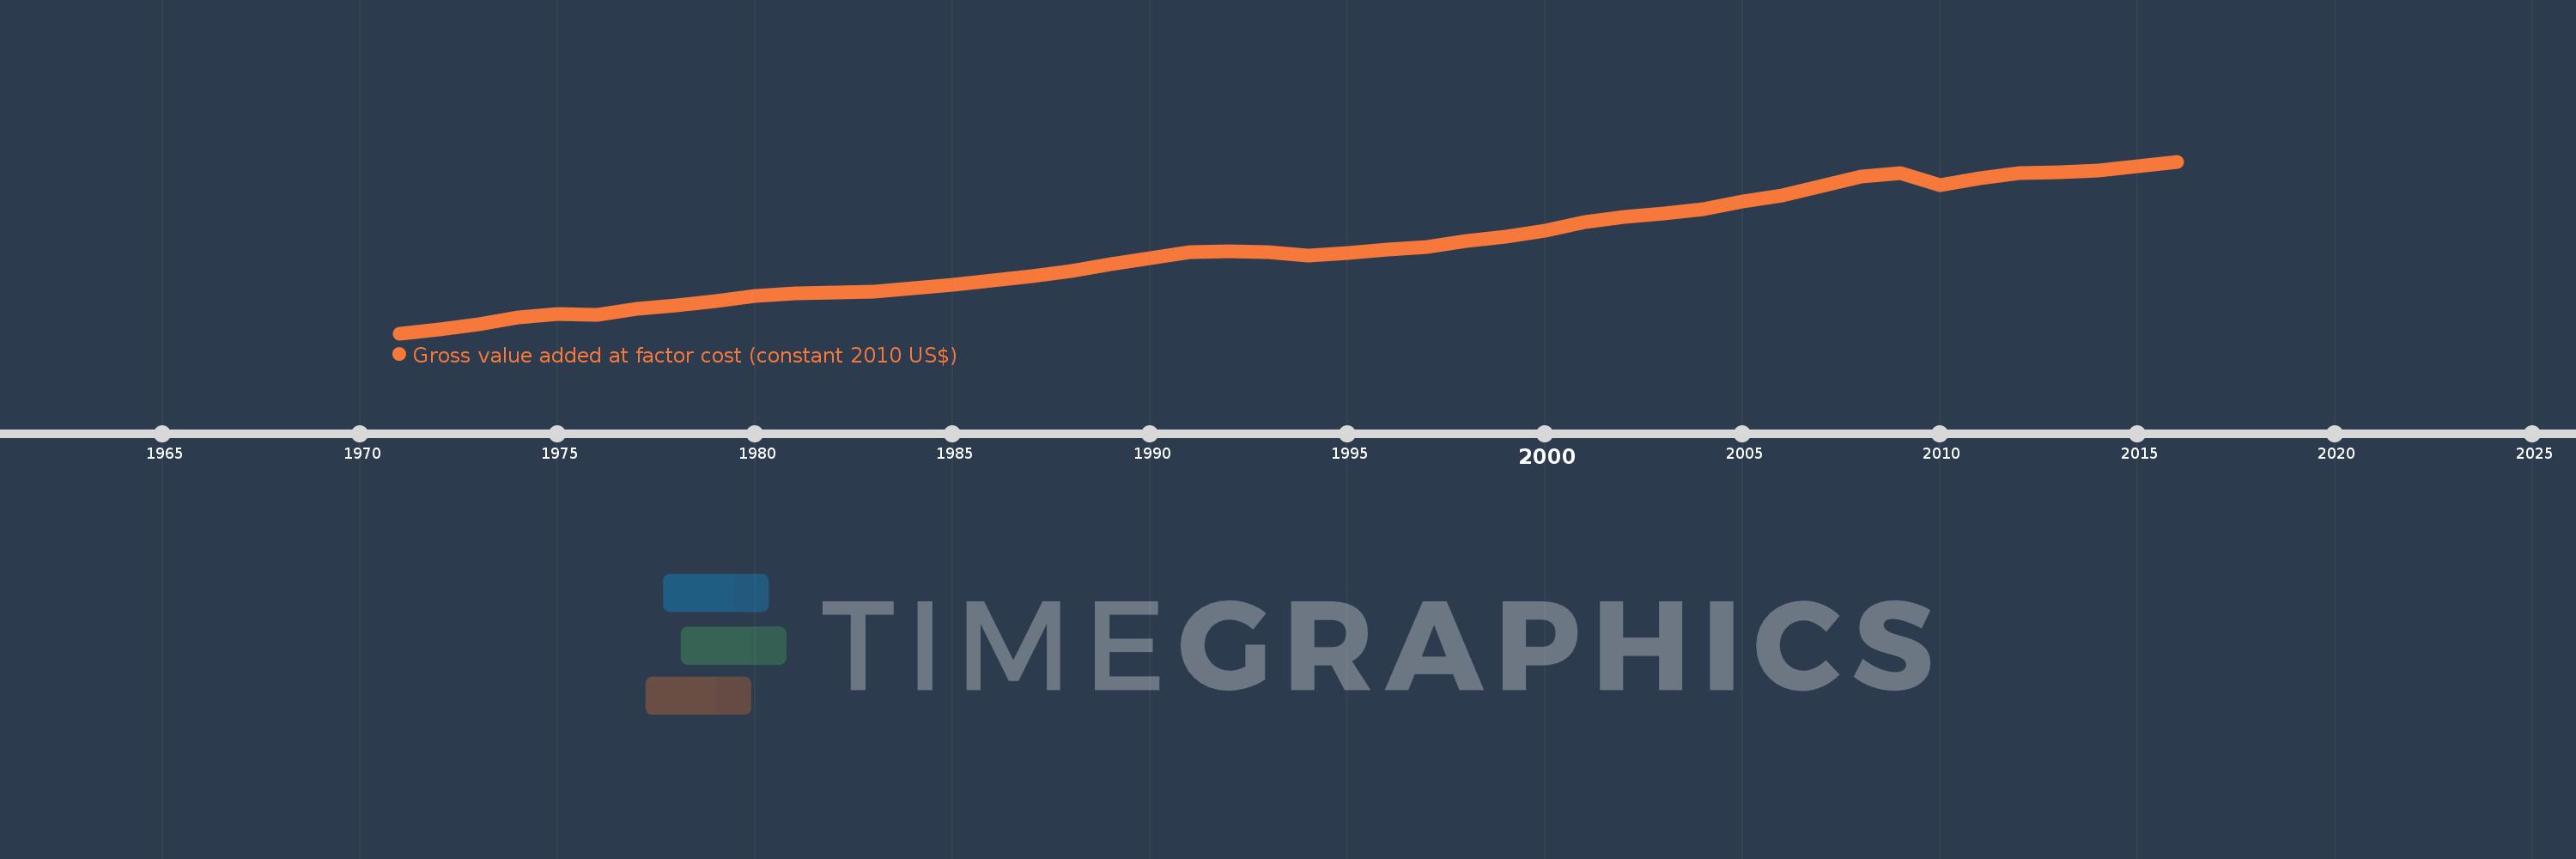
Gross value added at factor cost (constant 2010 US$)
2016,2015,2014,2013,2012,2011,2010,2009,2008,2007,2006,2005,2004,2003,2002,2001,2000,1999,1998,1997,1996,1995,1994,1993,1992,1991,1990,1989,1988,1987,1986,1985,1984,1983,1982,1981,1980,1979,1978,1977,1976,1975,1974,1973,1972,1971
Queste statistiche in altri paesi:
AfghanistanAlbaniaAlgeriaAndorraAntigua and BarbudaArgentinaArmeniaArubaAustraliaAustriaAzerbaijanBahamas, TheBangladeshBarbadosBelarusBelgiumBelizeBeninBermudaBhutanBoliviaBosnia and HerzegovinaBotswanaBrazilBulgariaBurkina FasoBurundiCabo VerdeCambodiaCameroonCanadaCaribbean small statesCentral African RepublicCentral Europe and the BalticsChadChileColombiaCongo, Dem. Rep.Costa RicaCroatiaCubaCyprusCzech RepublicDenmarkDominicaDominican RepublicEarly-demographic dividendEcuadorEgypt, Arab Rep.El SalvadorEquatorial GuineaEstoniaEthiopiaEuro areaEurope & Central AsiaEurope & Central Asia (excluding high income)Europe & Central Asia (IDA & IBRD countries)European UnionFaroe IslandsFijiFinlandFranceGabonGambia, TheGeorgiaGermanyGhanaGreeceGrenadaGuatemalaGuineaGuinea-BissauGuyanaHeavily indebted poor countries (HIPC)High incomeHondurasHong Kong SAR, ChinaHungaryIcelandIDA blendIDA onlyIDA totalIndiaIndonesiaIran, Islamic Rep.IrelandItalyJamaicaJapanJordanKazakhstanKenyaKiribatiKorea, Rep.KosovoKuwaitKyrgyz RepublicLao PDRLatin America & Caribbean Latin America & Caribbean (excluding high income)Latin America & the Caribbean (IDA & IBRD countries)LatviaLeast developed countries: UN classificationLebanonLesothoLiechtensteinLithuaniaLow incomeLower middle incomeLuxembourgMacao SAR, ChinaMacedonia, FYRMadagascarMalawiMaldivesMaliMaltaMarshall IslandsMauritaniaMauritiusMexicoMicronesia, Fed. Sts.Middle East & North Africa (excluding high income)Middle East & North Africa (IDA & IBRD countries)MoldovaMongoliaMontenegroMoroccoMozambiqueNamibiaNepalNetherlandsNew ZealandNicaraguaNigeriaNorth AmericaNorwayOECD membersPacific island small statesPakistanPalauPanamaParaguayPeruPolandPortugalPost-demographic dividendPre-demographic dividendRomaniaRussian FederationRwandaSao Tome and PrincipeSenegalSerbiaSeychellesSierra LeoneSingaporeSlovak RepublicSloveniaSouth AfricaSouth AsiaSouth Asia (IDA & IBRD)SpainSri LankaSt. Kitts and NevisSt. LuciaSt. Vincent and the GrenadinesSub-Saharan Africa Sub-Saharan Africa (excluding high income)Sub-Saharan Africa (IDA & IBRD countries)SudanSurinameSwazilandSwedenSwitzerlandTajikistanTanzaniaThailandTimor-LesteTongaTrinidad and TobagoTunisiaTurkeyTurkmenistanTuvaluUgandaUkraineUnited KingdomUnited StatesUruguayUzbekistanVanuatuVenezuela, RBVietnamWest Bank and GazaWorldZambiaZimbabwe Linea del tempo:
Questa scala temporale mostra un grafico dal 1971 anno al 2016 anno. Europe & Central Asia. I dati fino ad 1970 anno non disponibili. Il numero di osservazioni attuali secondo i date: 46.
La fonte (nome):
Indicatori dello sviluppo mondiale
La fonte (organizzazione):
World Bank national accounts data, and OECD National Accounts data files.
Categorie:
Economy & Growth
sono stati aggiornati
23 apr 2017 anni
Indicatori delle variazioni dei valori per anni
Minima:
7.521 Trln
1 gen 1971 anni
Massimo:
19.93 Trln
1 gen 2016 anni
Alla data di osservazione
Valore
Variazione assoluta
La variazione rispetto al valore precedente
1 gen 1971 anni
7.521 Trln
+7.521 Trln
0.0%
1 gen 1972 anni
7.807 Trln
+286.552 Mlrd
3.81%
1 gen 1973 anni
8.175 Trln
+368.276 Mlrd
4.72%
1 gen 1974 anni
8.676 Trln
+500.356 Mlrd
6.12%
1 gen 1975 anni
8.938 Trln
+262.378 Mlrd
3.02%
1 gen 1976 anni
8.87 Trln
-67.819 Mlrd
-0.76%
1 gen 1977 anni
9.28 Trln
+410.057 Mlrd
4.62%
1 gen 1978 anni
9.557 Trln
+276.892 Mlrd
2.98%
1 gen 1979 anni
9.853 Trln
+295.504 Mlrd
3.09%
1 gen 1980 anni
10.208 Trln
+354.839 Mlrd
3.6%
1 gen 1981 anni
10.382 Trln
+174.672 Mlrd
1.71%
1 gen 1982 anni
10.447 Trln
+65.159 Mlrd
0.63%
1 gen 1983 anni
10.547 Trln
+99.432 Mlrd
0.95%
1 gen 1984 anni
10.752 Trln
+204.689 Mlrd
1.94%
1 gen 1985 anni
11.043 Trln
+291.245 Mlrd
2.71%
1 gen 1986 anni
11.353 Trln
+310.293 Mlrd
2.81%
1 gen 1987 anni
11.656 Trln
+302.596 Mlrd
2.67%
1 gen 1988 anni
12.001 Trln
+345.259 Mlrd
2.96%
1 gen 1989 anni
12.509 Trln
+508.416 Mlrd
4.24%
1 gen 1990 anni
12.973 Trln
+463.25 Mlrd
3.7%
1 gen 1991 anni
13.376 Trln
+403.57 Mlrd
3.11%
1 gen 1992 anni
13.454 Trln
+78.016 Mlrd
0.58%
1 gen 1993 anni
13.36 Trln
-93.952 Mlrd
-0.7%
1 gen 1994 anni
13.158 Trln
-201.997 Mlrd
-1.51%
1 gen 1995 anni
13.299 Trln
+140.407 Mlrd
1.07%
1 gen 1996 anni
13.546 Trln
+247.091 Mlrd
1.86%
1 gen 1997 anni
13.784 Trln
+238.572 Mlrd
1.76%
1 gen 1998 anni
14.165 Trln
+380.32 Mlrd
2.76%
1 gen 1999 anni
14.517 Trln
+351.98 Mlrd
2.48%
1 gen 2000 anni
14.924 Trln
+407.075 Mlrd
2.8%
1 gen 2001 anni
15.576 Trln
+652.678 Mlrd
4.37%
1 gen 2002 anni
15.935 Trln
+358.73 Mlrd
2.3%
1 gen 2003 anni
16.202 Trln
+267.369 Mlrd
1.68%
1 gen 2004 anni
16.494 Trln
+291.179 Mlrd
1.8%
1 gen 2005 anni
17.03 Trln
+535.984 Mlrd
3.25%
1 gen 2006 anni
17.47 Trln
+440.054 Mlrd
2.58%
1 gen 2007 anni
18.152 Trln
+682.001 Mlrd
3.9%
1 gen 2008 anni
18.844 Trln
+692.488 Mlrd
3.82%
1 gen 2009 anni
19.065 Trln
+220.486 Mlrd
1.17%
1 gen 2010 anni
18.224 Trln
-840.424 Mlrd
-4.41%
1 gen 2011 anni
18.705 Trln
+480.608 Mlrd
2.64%
1 gen 2012 anni
19.111 Trln
+406.078 Mlrd
2.17%
1 gen 2013 anni
19.151 Trln
+40.527 Mlrd
0.21%
1 gen 2014 anni
19.273 Trln
+121.465 Mlrd
0.63%
1 gen 2015 anni
19.596 Trln
+323.417 Mlrd
1.68%
1 gen 2016 anni
19.93 Trln
+333.212 Mlrd
1.7%
Classificazione dei paesi secondo i statistiche attuali per anni


Commenti: