29
/it/
it
AIzaSyAYiBZKx7MnpbEhh9jyipgxe19OcubqV5w
April 1, 2024
29904
Euro area
EMU
false
2
1
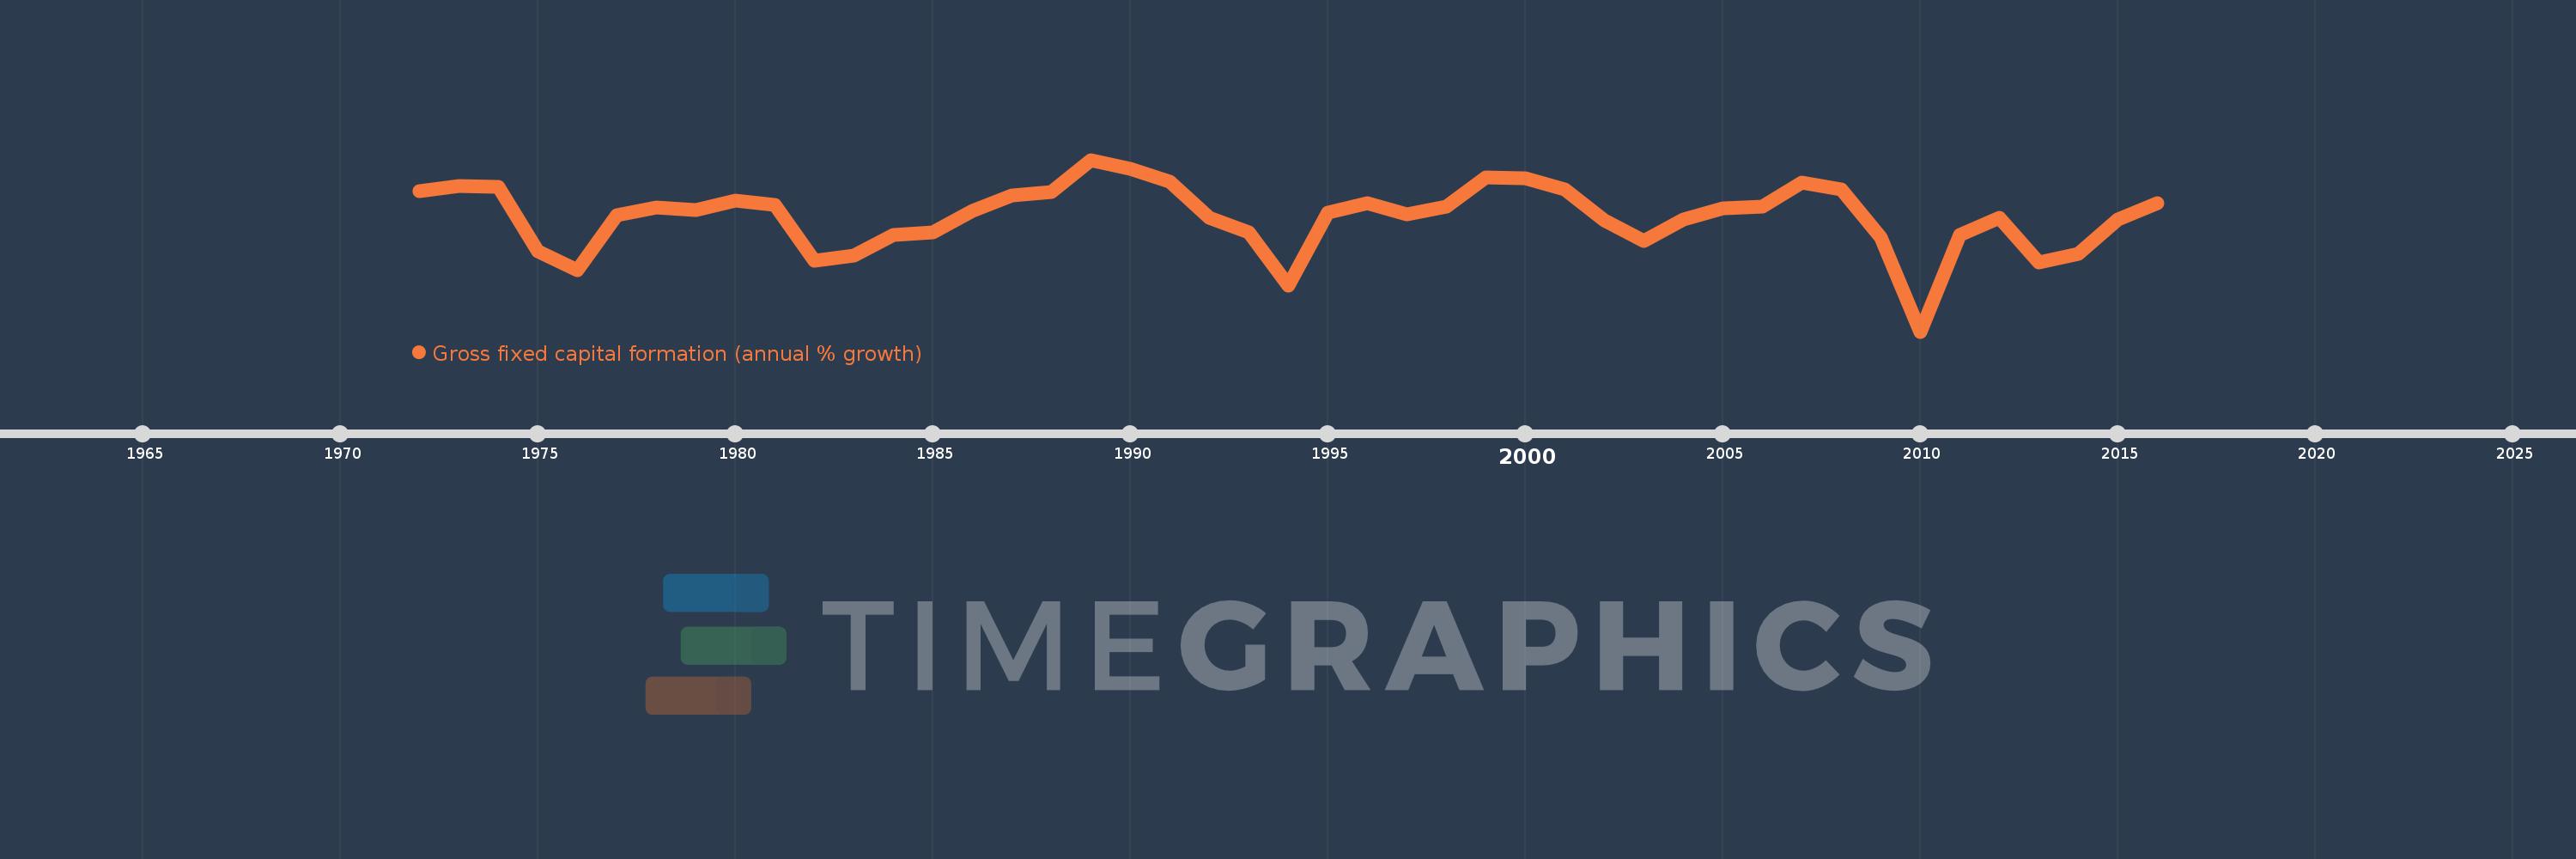
Gross fixed capital formation (annual % growth)
2016,2015,2014,2013,2012,2011,2010,2009,2008,2007,2006,2005,2004,2003,2002,2001,2000,1999,1998,1997,1996,1995,1994,1993,1992,1991,1990,1989,1988,1987,1986,1985,1984,1983,1982,1981,1980,1979,1978,1977,1976,1975,1974,1973,1972
Queste statistiche in altri paesi:
AlbaniaAlgeriaAntigua and BarbudaArab WorldArgentinaArmeniaAustraliaAustriaAzerbaijanBahamas, TheBahrainBangladeshBarbadosBelarusBelgiumBelizeBeninBhutanBoliviaBosnia and HerzegovinaBotswanaBrazilBrunei DarussalamBulgariaBurkina FasoBurundiCabo VerdeCambodiaCameroonCanadaCaribbean small statesCentral Europe and the BalticsChadChileChinaColombiaComorosCongo, Dem. Rep.Congo, Rep.Costa RicaCote d'IvoireCroatiaCubaCyprusCzech RepublicDenmarkDjiboutiDominican RepublicEarly-demographic dividendEast Asia & PacificEast Asia & Pacific (excluding high income)East Asia & Pacific (IDA & IBRD countries)EcuadorEgypt, Arab Rep.El SalvadorEquatorial GuineaEritreaEstoniaEthiopiaEuro areaEurope & Central AsiaEurope & Central Asia (excluding high income)Europe & Central Asia (IDA & IBRD countries)European UnionFinlandFranceGabonGambia, TheGeorgiaGermanyGhanaGreeceGuatemalaGuineaGuinea-BissauHaitiHeavily indebted poor countries (HIPC)High incomeHondurasHong Kong SAR, ChinaHungaryIBRD onlyIcelandIDA & IBRD totalIDA blendIDA onlyIDA totalIndiaIndonesiaIran, Islamic Rep.IrelandIsraelItalyJamaicaJapanJordanKazakhstanKenyaKorea, Rep.KosovoKyrgyz RepublicLao PDRLate-demographic dividendLatin America & Caribbean Latin America & Caribbean (excluding high income)Latin America & the Caribbean (IDA & IBRD countries)LatviaLeast developed countries: UN classificationLebanonLiberiaLithuaniaLow & middle incomeLow incomeLower middle incomeLuxembourgMacao SAR, ChinaMacedonia, FYRMadagascarMalawiMalaysiaMaliMaltaMauritaniaMauritiusMexicoMiddle East & North AfricaMiddle East & North Africa (excluding high income)Middle East & North Africa (IDA & IBRD countries)Middle incomeMoldovaMongoliaMontenegroMoroccoMozambiqueNamibiaNepalNetherlandsNew ZealandNicaraguaNigerNigeriaNorth AmericaNorwayOECD membersOmanPakistanPanamaPapua New GuineaParaguayPeruPhilippinesPolandPortugalPost-demographic dividendPre-demographic dividendPuerto RicoRomaniaRussian FederationRwandaSaudi ArabiaSenegalSerbiaSeychellesSierra LeoneSingaporeSlovak RepublicSloveniaSomaliaSouth AfricaSouth AsiaSouth Asia (IDA & IBRD)South SudanSpainSri LankaSub-Saharan Africa Sub-Saharan Africa (excluding high income)Sub-Saharan Africa (IDA & IBRD countries)SudanSurinameSwazilandSwedenSwitzerlandSyrian Arab RepublicTajikistanTanzaniaThailandTimor-LesteTogoTrinidad and TobagoTunisiaTurkeyUgandaUkraineUnited Arab EmiratesUnited KingdomUnited StatesUpper middle incomeUruguayUzbekistanVanuatuVenezuela, RBVietnamWest Bank and GazaWorldZimbabwe Linea del tempo:
Questa scala temporale mostra un grafico dal 1972 anno al 2016 anno. Euro area. I dati fino ad 1971 anno non disponibili. Il numero di osservazioni attuali secondo i date: 45.
La fonte (nome):
Indicatori dello sviluppo mondiale
La fonte (organizzazione):
World Bank national accounts data, and OECD National Accounts data files.
Categorie:
Economy & Growth
sono stati aggiornati
23 apr 2017 anni
Indicatori delle variazioni dei valori per anni
Minima:
-11.134
1 gen 2010 anni
Massimo:
8.117
1 gen 1989 anni
Alla data di osservazione
Valore
Variazione assoluta
La variazione rispetto al valore precedente
1 gen 1972 anni
4.561
+4.561
0.0%
1 gen 1973 anni
5.226
+0.665
14.58%
1 gen 1974 anni
5.112
-0.115
-2.2%
1 gen 1975 anni
-2.128
-7.24
-141.63%
1 gen 1976 anni
-4.232
-2.104
98.86%
1 gen 1977 anni
1.921
+6.153
-145.4%
1 gen 1978 anni
2.796
+0.875
45.54%
1 gen 1979 anni
2.438
-0.359
-12.83%
1 gen 1980 anni
3.562
+1.124
46.1%
1 gen 1981 anni
3.095
-0.467
-13.1%
1 gen 1982 anni
-3.225
-6.32
-204.21%
1 gen 1983 anni
-2.639
+0.586
-18.17%
1 gen 1984 anni
-0.336
+2.304
-87.28%
1 gen 1985 anni
-0.059
+0.277
-82.55%
1 gen 1986 anni
2.415
+2.473
-4.22 Mille.%
1 gen 1987 anni
4.098
+1.684
69.73%
1 gen 1988 anni
4.511
+0.412
10.06%
1 gen 1989 anni
8.117
+3.606
79.95%
1 gen 1990 anni
7.108
-1.01
-12.44%
1 gen 1991 anni
5.659
-1.449
-20.38%
1 gen 1992 anni
1.651
-4.007
-70.82%
1 gen 1993 anni
0.022
-1.629
-98.66%
1 gen 1994 anni
-5.986
-6.008
-27.13 Mille.%
1 gen 1995 anni
2.203
+8.189
-136.81%
1 gen 1996 anni
3.294
+1.091
49.51%
1 gen 1997 anni
2.014
-1.28
-38.85%
1 gen 1998 anni
2.912
+0.898
44.58%
1 gen 1999 anni
6.109
+3.197
109.77%
1 gen 2000 anni
6.063
-0.046
-0.75%
1 gen 2001 anni
4.773
-1.29
-21.28%
1 gen 2002 anni
1.332
-3.441
-72.09%
1 gen 2003 anni
-0.971
-2.303
-172.89%
1 gen 2004 anni
1.393
+2.364
-243.41%
1 gen 2005 anni
2.677
+1.285
92.26%
1 gen 2006 anni
2.853
+0.175
6.55%
1 gen 2007 anni
5.565
+2.712
95.07%
1 gen 2008 anni
4.801
-0.764
-13.73%
1 gen 2009 anni
-0.593
-5.394
-112.35%
1 gen 2010 anni
-11.134
-10.541
1.78 Mille.%
1 gen 2011 anni
-0.308
+10.826
-97.23%
1 gen 2012 anni
1.573
+1.88
-610.8%
1 gen 2013 anni
-3.34
-4.912
-312.38%
1 gen 2014 anni
-2.443
+0.897
-26.86%
1 gen 2015 anni
1.455
+3.898
-159.56%
1 gen 2016 anni
3.276
+1.821
125.18%
Classificazione dei paesi secondo i statistiche attuali per anni


Commenti: