29
/it/
it
AIzaSyAYiBZKx7MnpbEhh9jyipgxe19OcubqV5w
April 1, 2024
193081
Mauritania
MRT
true
2
1
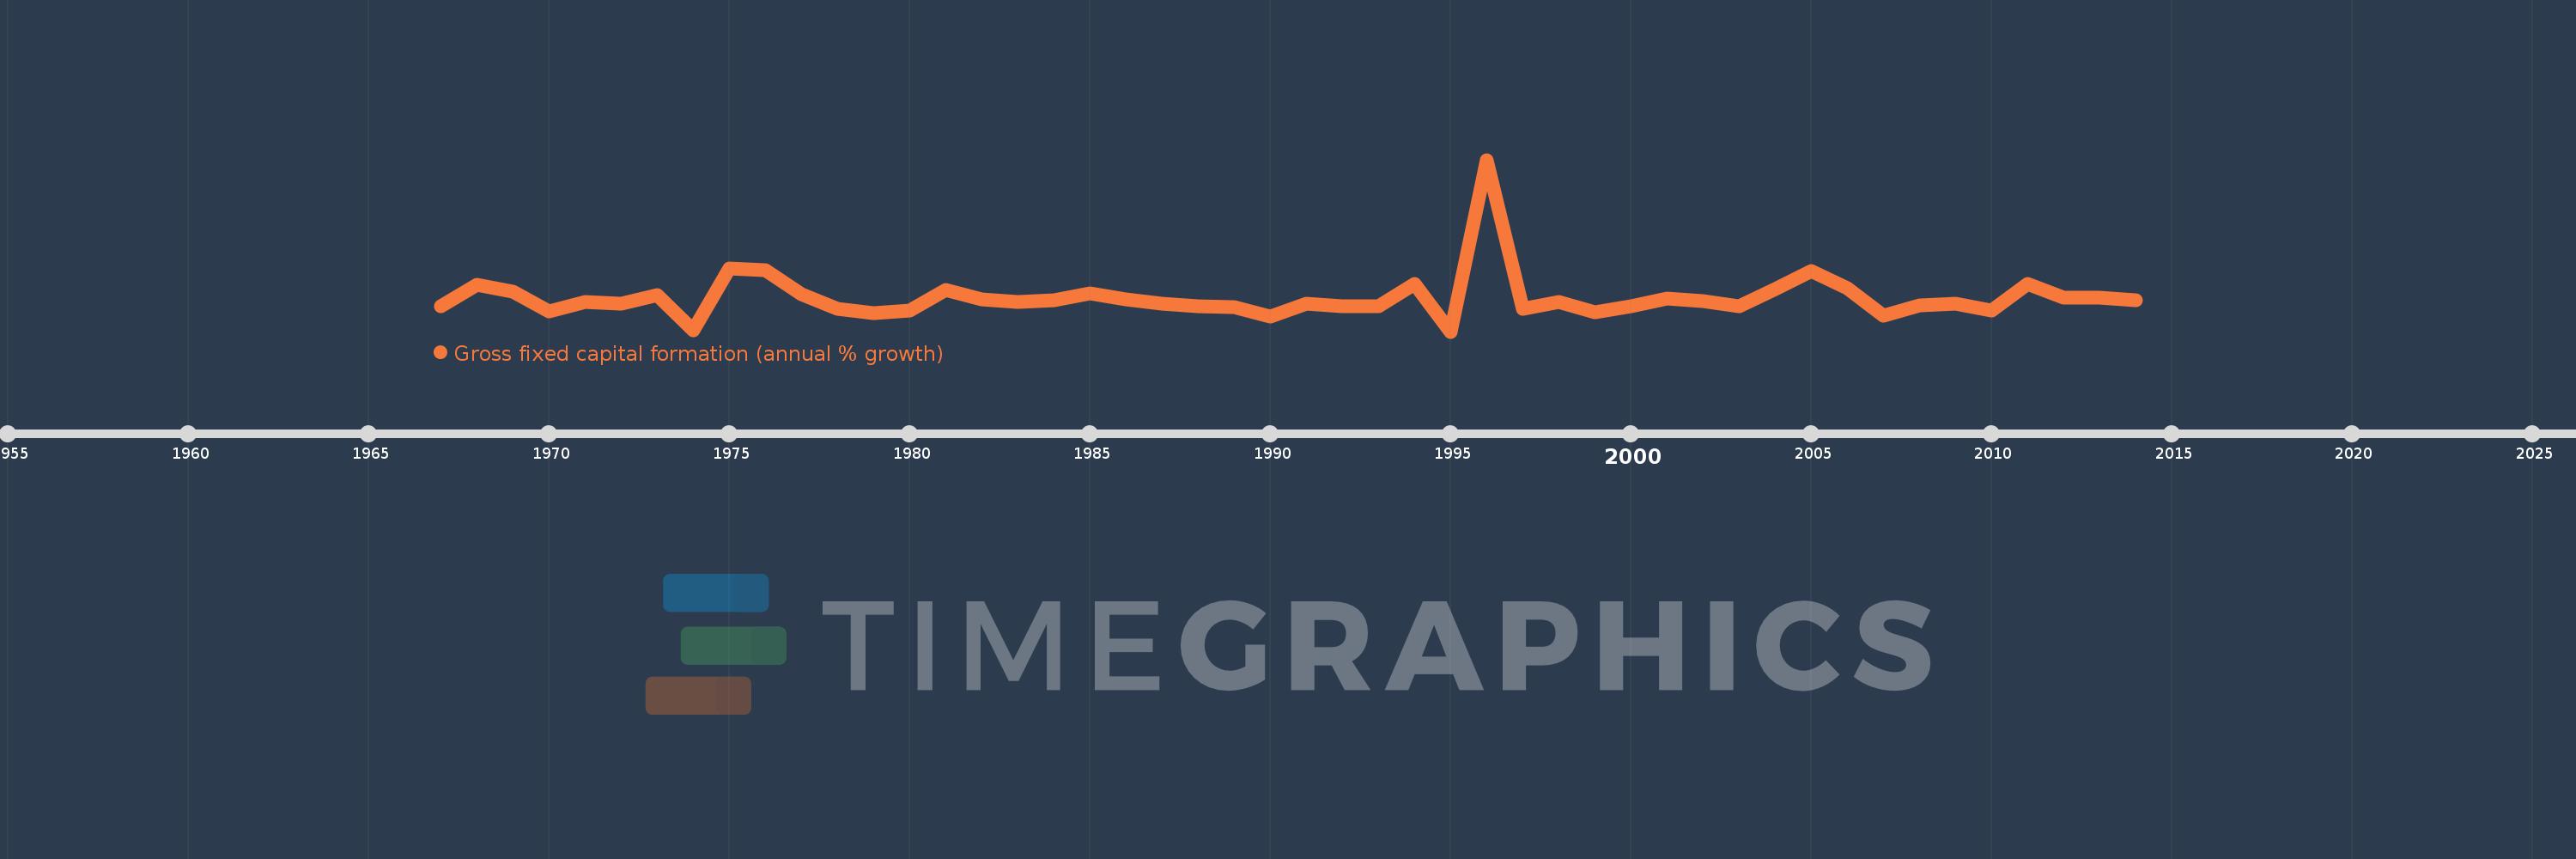
Gross fixed capital formation (annual % growth)
2014,2013,2012,2011,2010,2009,2008,2007,2006,2005,2004,2003,2002,2001,2000,1999,1998,1997,1996,1995,1994,1993,1992,1991,1990,1989,1988,1987,1986,1985,1984,1983,1982,1981,1980,1979,1978,1977,1976,1975,1974,1973,1972,1971,1970,1969,1968,1967
Queste statistiche in altri paesi:
AlbaniaAlgeriaAntigua and BarbudaArab WorldArgentinaArmeniaAustraliaAustriaAzerbaijanBahamas, TheBahrainBangladeshBarbadosBelarusBelgiumBelizeBeninBhutanBoliviaBosnia and HerzegovinaBotswanaBrazilBrunei DarussalamBulgariaBurkina FasoBurundiCabo VerdeCambodiaCameroonCanadaCaribbean small statesCentral Europe and the BalticsChadChileChinaColombiaComorosCongo, Dem. Rep.Congo, Rep.Costa RicaCote d'IvoireCroatiaCubaCyprusCzech RepublicDenmarkDjiboutiDominican RepublicEarly-demographic dividendEast Asia & PacificEast Asia & Pacific (excluding high income)East Asia & Pacific (IDA & IBRD countries)EcuadorEgypt, Arab Rep.El SalvadorEquatorial GuineaEritreaEstoniaEthiopiaEuro areaEurope & Central AsiaEurope & Central Asia (excluding high income)Europe & Central Asia (IDA & IBRD countries)European UnionFinlandFranceGabonGambia, TheGeorgiaGermanyGhanaGreeceGuatemalaGuineaGuinea-BissauHaitiHeavily indebted poor countries (HIPC)High incomeHondurasHong Kong SAR, ChinaHungaryIBRD onlyIcelandIDA & IBRD totalIDA blendIDA onlyIDA totalIndiaIndonesiaIran, Islamic Rep.IrelandIsraelItalyJamaicaJapanJordanKazakhstanKenyaKorea, Rep.KosovoKyrgyz RepublicLao PDRLate-demographic dividendLatin America & Caribbean Latin America & Caribbean (excluding high income)Latin America & the Caribbean (IDA & IBRD countries)LatviaLeast developed countries: UN classificationLebanonLiberiaLithuaniaLow & middle incomeLow incomeLower middle incomeLuxembourgMacao SAR, ChinaMacedonia, FYRMadagascarMalawiMalaysiaMaliMaltaMauritaniaMauritiusMexicoMiddle East & North AfricaMiddle East & North Africa (excluding high income)Middle East & North Africa (IDA & IBRD countries)Middle incomeMoldovaMongoliaMontenegroMoroccoMozambiqueNamibiaNepalNetherlandsNew ZealandNicaraguaNigerNigeriaNorth AmericaNorwayOECD membersOmanPakistanPanamaPapua New GuineaParaguayPeruPhilippinesPolandPortugalPost-demographic dividendPre-demographic dividendPuerto RicoRomaniaRussian FederationRwandaSaudi ArabiaSenegalSerbiaSeychellesSierra LeoneSingaporeSlovak RepublicSloveniaSomaliaSouth AfricaSouth AsiaSouth Asia (IDA & IBRD)South SudanSpainSri LankaSub-Saharan Africa Sub-Saharan Africa (excluding high income)Sub-Saharan Africa (IDA & IBRD countries)SudanSurinameSwazilandSwedenSwitzerlandSyrian Arab RepublicTajikistanTanzaniaThailandTimor-LesteTogoTrinidad and TobagoTunisiaTurkeyUgandaUkraineUnited Arab EmiratesUnited KingdomUnited StatesUpper middle incomeUruguayUzbekistanVanuatuVenezuela, RBVietnamWest Bank and GazaWorldZimbabwe Linea del tempo:
Questa scala temporale mostra un grafico dal 1967 anno al 2014 anno. Mauritania. I dati fino ad 1966 anno non disponibili. Il numero di osservazioni attuali secondo i date: 48.
La fonte (nome):
Indicatori dello sviluppo mondiale
La fonte (organizzazione):
World Bank national accounts data, and OECD National Accounts data files.
Categorie:
Economy & Growth
sono stati aggiornati
23 apr 2017 anni
Indicatori delle variazioni dei valori per anni
Minima:
-76.306
1 gen 1995 anni
Massimo:
429.056
1 gen 1996 anni
Alla data di osservazione
Valore
Variazione assoluta
La variazione rispetto al valore precedente
1 gen 1967 anni
-1.159
-1.159
0.0%
1 gen 1968 anni
61.718
+62.876
-5.43 Mille.%
1 gen 1969 anni
41.396
-20.322
-32.93%
1 gen 1970 anni
-17.375
-58.771
-141.97%
1 gen 1971 anni
9.837
+27.212
-156.62%
1 gen 1972 anni
5.636
-4.201
-42.71%
1 gen 1973 anni
32.087
+26.451
469.33%
1 gen 1974 anni
-72.89
-104.977
-327.16%
1 gen 1975 anni
108.932
+181.821
-249.45%
1 gen 1976 anni
103.332
-5.6
-5.14%
1 gen 1977 anni
33.457
-69.875
-67.62%
1 gen 1978 anni
-9.508
-42.965
-128.42%
1 gen 1979 anni
-21.143
-11.635
122.37%
1 gen 1980 anni
-13.705
+7.438
-35.18%
1 gen 1981 anni
46.746
+60.452
-441.08%
1 gen 1982 anni
19.623
-27.124
-58.02%
1 gen 1983 anni
9.885
-9.738
-49.63%
1 gen 1984 anni
14.95
+5.065
51.24%
1 gen 1985 anni
36.0
+21.05
140.8%
1 gen 1986 anni
18.695
-17.305
-48.07%
1 gen 1987 anni
5.365
-13.33
-71.3%
1 gen 1988 anni
-1.877
-7.242
-135.0%
1 gen 1989 anni
-3.055
-1.178
62.74%
1 gen 1990 anni
-31.456
-28.4
929.53%
1 gen 1991 anni
5.628
+37.083
-117.89%
1 gen 1992 anni
-2.788
-8.415
-149.53%
1 gen 1993 anni
-2.788
+0.0
0.0%
1 gen 1994 anni
63.259
+66.047
-2.37 Mille.%
1 gen 1995 anni
-76.306
-139.566
-220.63%
1 gen 1996 anni
429.056
+505.363
-662.28%
1 gen 1997 anni
-9.689
-438.746
-102.26%
1 gen 1998 anni
10.795
+20.484
-211.41%
1 gen 1999 anni
-20.09
-30.885
-286.11%
1 gen 2000 anni
-1.957
+18.133
-90.26%
1 gen 2001 anni
21.065
+23.023
-1.18 Mille.%
1 gen 2002 anni
13.309
-7.757
-36.82%
1 gen 2003 anni
-1.609
-14.917
-112.09%
1 gen 2004 anni
49.389
+50.997
-3.17 Mille.%
1 gen 2005 anni
102.831
+53.442
108.21%
1 gen 2006 anni
52.139
-50.691
-49.3%
1 gen 2007 anni
-29.365
-81.504
-156.32%
1 gen 2008 anni
0.24
+29.605
-100.82%
1 gen 2009 anni
5.789
+5.55
2.32 Mille.%
1 gen 2010 anni
-13.459
-19.248
-332.47%
1 gen 2011 anni
64.105
+77.564
-576.32%
1 gen 2012 anni
22.384
-41.721
-65.08%
1 gen 2013 anni
24.109
+1.726
7.71%
1 gen 2014 anni
14.777
-9.333
-38.71%
Classificazione dei paesi secondo i statistiche attuali per anni


Commenti: