29
/it/
it
AIzaSyAYiBZKx7MnpbEhh9jyipgxe19OcubqV5w
April 1, 2024
285637
Zambia
ZMB
true
2
1
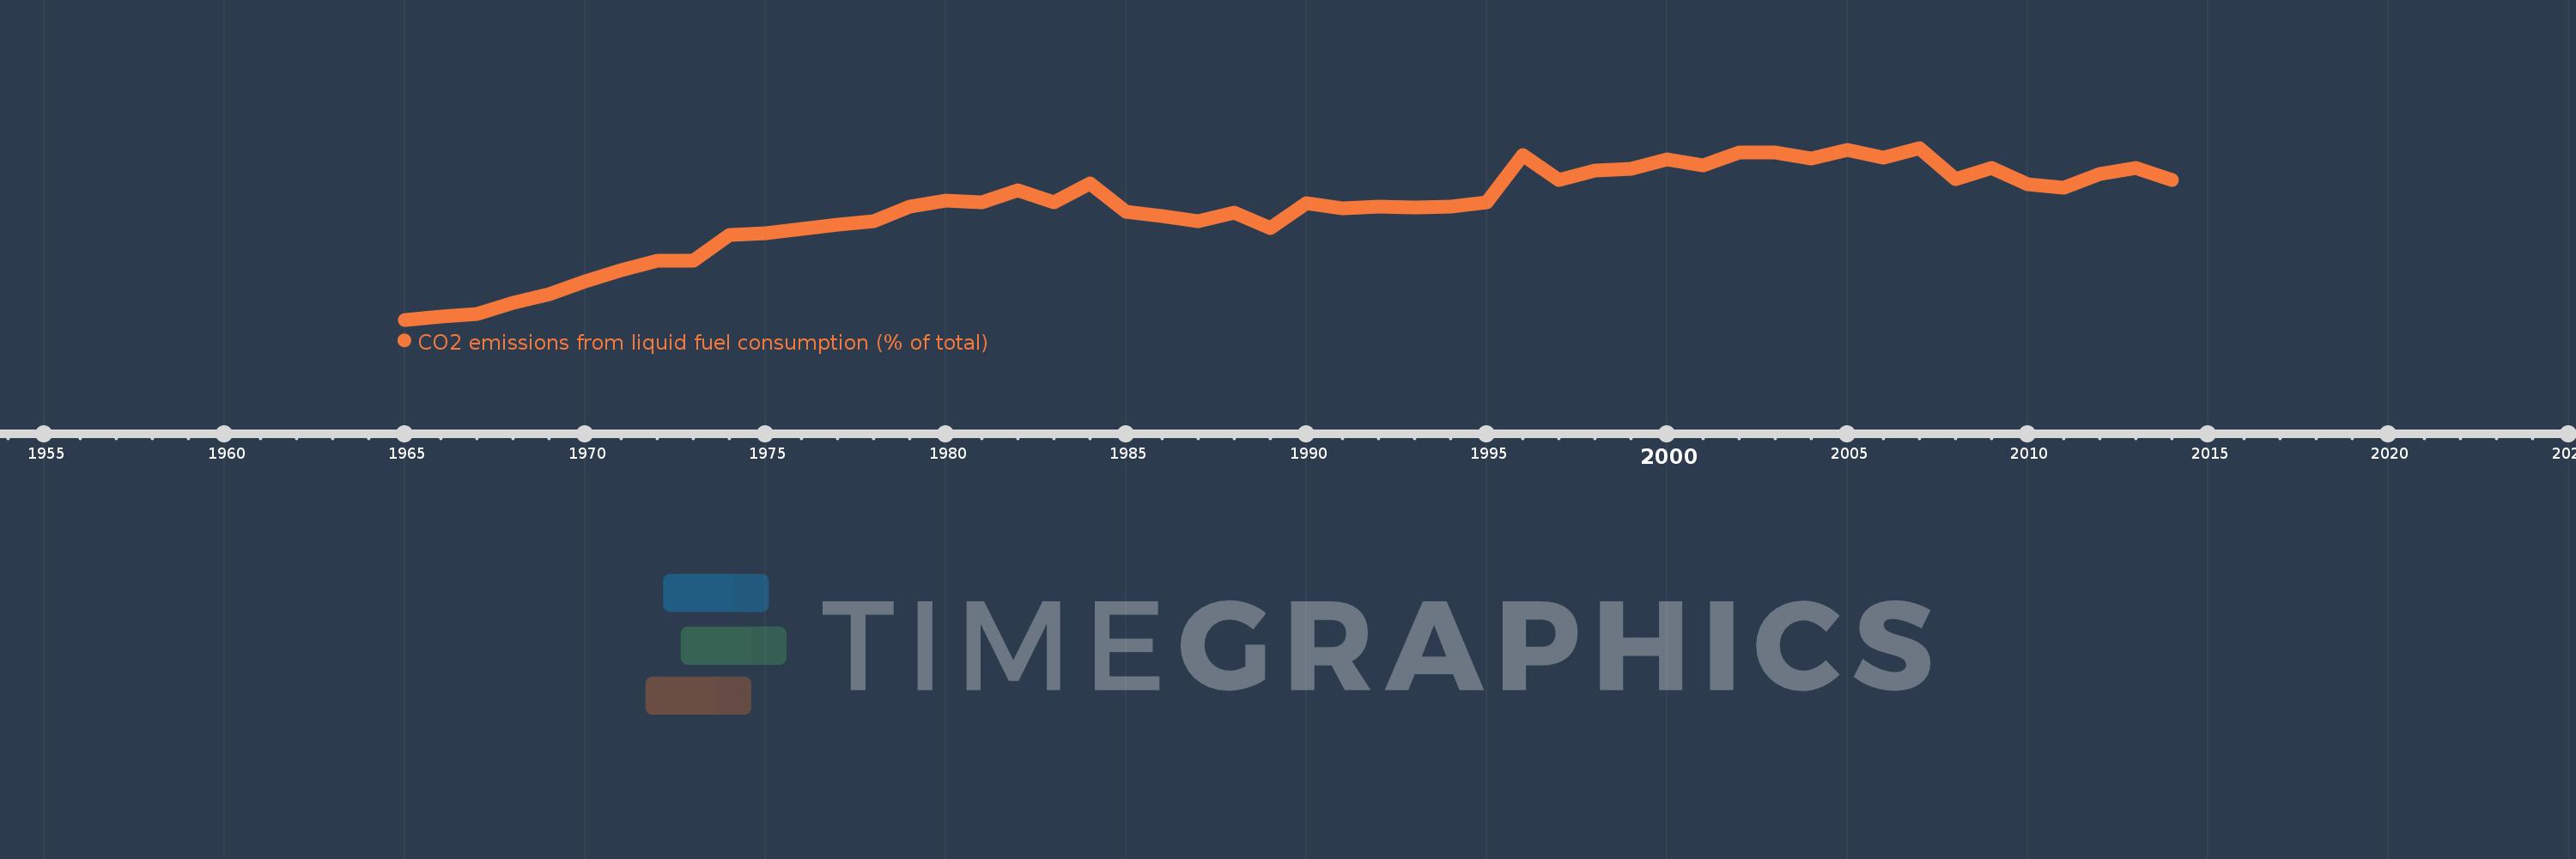
CO2 emissions from liquid fuel consumption (% of total)
2014,2013,2012,2011,2010,2009,2008,2007,2006,2005,2004,2003,2002,2001,2000,1999,1998,1997,1996,1995,1994,1993,1992,1991,1990,1989,1988,1987,1986,1985,1984,1983,1982,1981,1980,1979,1978,1977,1976,1975,1974,1973,1972,1971,1970,1969,1968,1967,1966,1965
Queste statistiche in altri paesi:
AfghanistanAlbaniaAlgeriaAndorraAngolaAntigua and BarbudaArab WorldArgentinaArmeniaArubaAustraliaAustriaAzerbaijanBahamas, TheBahrainBangladeshBarbadosBelarusBelgiumBelizeBeninBermudaBhutanBoliviaBosnia and HerzegovinaBotswanaBrazilBritish Virgin IslandsBrunei DarussalamBulgariaBurkina FasoBurundiCabo VerdeCambodiaCameroonCanadaCaribbean small statesCayman IslandsCentral African RepublicCentral Europe and the BalticsChadChileChinaColombiaComorosCongo, Dem. Rep.Congo, Rep.Costa RicaCote d'IvoireCroatiaCubaCuracaoCyprusCzech RepublicDenmarkDjiboutiDominicaDominican RepublicEarly-demographic dividendEast Asia & PacificEast Asia & Pacific (excluding high income)East Asia & Pacific (IDA & IBRD countries)EcuadorEgypt, Arab Rep.El SalvadorEquatorial GuineaEritreaEstoniaEthiopiaEuro areaEurope & Central AsiaEurope & Central Asia (excluding high income)Europe & Central Asia (IDA & IBRD countries)European UnionFaroe IslandsFijiFinlandFragile and conflict affected situationsFranceFrench PolynesiaGabonGambia, TheGeorgiaGermanyGhanaGibraltarGreeceGreenlandGrenadaGuatemalaGuineaGuinea-BissauGuyanaHaitiHeavily indebted poor countries (HIPC)High incomeHondurasHong Kong SAR, ChinaHungaryIBRD onlyIcelandIDA & IBRD totalIDA blendIDA onlyIDA totalIndiaIndonesiaIran, Islamic Rep.IraqIrelandIsraelItalyJamaicaJapanJordanKazakhstanKenyaKiribatiKorea, Dem. People’s Rep.Korea, Rep.KuwaitKyrgyz RepublicLao PDRLate-demographic dividendLatin America & Caribbean Latin America & Caribbean (excluding high income)Latin America & the Caribbean (IDA & IBRD countries)LatviaLeast developed countries: UN classificationLebanonLesothoLiberiaLibyaLiechtensteinLithuaniaLow & middle incomeLow incomeLower middle incomeLuxembourgMacao SAR, ChinaMacedonia, FYRMadagascarMalawiMalaysiaMaldivesMaliMaltaMarshall IslandsMauritaniaMauritiusMexicoMicronesia, Fed. Sts.Middle East & North AfricaMiddle East & North Africa (excluding high income)Middle East & North Africa (IDA & IBRD countries)Middle incomeMoldovaMongoliaMontenegroMoroccoMozambiqueMyanmarNamibiaNauruNepalNetherlandsNew CaledoniaNew ZealandNicaraguaNigerNigeriaNorth AmericaNorwayOECD membersOmanOther small statesPacific island small statesPakistanPalauPanamaPapua New GuineaParaguayPeruPhilippinesPolandPortugalPost-demographic dividendPre-demographic dividendQatarRomaniaRussian FederationRwandaSamoaSao Tome and PrincipeSaudi ArabiaSenegalSerbiaSeychellesSierra LeoneSingaporeSint Maarten (Dutch part)Slovak RepublicSloveniaSmall statesSolomon IslandsSomaliaSouth AfricaSouth AsiaSouth Asia (IDA & IBRD)South SudanSpainSri LankaSt. Kitts and NevisSt. LuciaSt. Vincent and the GrenadinesSub-Saharan Africa Sub-Saharan Africa (excluding high income)Sub-Saharan Africa (IDA & IBRD countries)SudanSurinameSwazilandSwedenSwitzerlandSyrian Arab RepublicTajikistanTanzaniaThailandTimor-LesteTogoTongaTrinidad and TobagoTunisiaTurkeyTurkmenistanTurks and Caicos IslandsUgandaUkraineUnited Arab EmiratesUnited KingdomUnited StatesUpper middle incomeUruguayUzbekistanVanuatuVenezuela, RBVietnamWest Bank and GazaWorldYemen, Rep.ZambiaZimbabwe Linea del tempo:
Questa scala temporale mostra un grafico dal 1965 anno al 2014 anno. Zambia. I dati fino ad 1964 anno non disponibili. Il numero di osservazioni attuali secondo i date: 50.
La fonte (nome):
Indicatori dello sviluppo mondiale
La fonte (organizzazione):
Carbon Dioxide Information Analysis Center, Environmental Sciences Division, Oak Ridge National Laboratory, Tennessee, United States.
Categorie:
Climate Change, Environment
sono stati aggiornati
23 apr 2017 anni
Indicatori delle variazioni dei valori per anni
Minima:
13.647
1 gen 1965 anni
Massimo:
80.594
1 gen 2007 anni
Alla data di osservazione
Valore
Variazione assoluta
La variazione rispetto al valore precedente
1 gen 1965 anni
13.647
+13.647
0.0%
1 gen 1966 anni
14.888
+1.241
9.09%
1 gen 1967 anni
15.812
+0.924
6.21%
1 gen 1968 anni
20.122
+4.311
27.26%
1 gen 1969 anni
23.577
+3.454
17.17%
1 gen 1970 anni
28.559
+4.983
21.13%
1 gen 1971 anni
32.977
+4.417
15.47%
1 gen 1972 anni
36.557
+3.58
10.86%
1 gen 1973 anni
36.519
-0.038
-0.1%
1 gen 1974 anni
46.565
+10.046
27.51%
1 gen 1975 anni
47.469
+0.904
1.94%
1 gen 1976 anni
48.967
+1.497
3.15%
1 gen 1977 anni
50.638
+1.671
3.41%
1 gen 1978 anni
52.204
+1.566
3.09%
1 gen 1979 anni
57.806
+5.602
10.73%
1 gen 1980 anni
59.919
+2.113
3.65%
1 gen 1981 anni
59.398
-0.521
-0.87%
1 gen 1982 anni
64.161
+4.764
8.02%
1 gen 1983 anni
59.375
-4.786
-7.46%
1 gen 1984 anni
66.704
+7.329
12.34%
1 gen 1985 anni
55.657
-11.047
-16.56%
1 gen 1986 anni
54.061
-1.595
-2.87%
1 gen 1987 anni
51.904
-2.158
-3.99%
1 gen 1988 anni
55.224
+3.32
6.4%
1 gen 1989 anni
49.475
-5.749
-10.41%
1 gen 1990 anni
59.014
+9.539
19.28%
1 gen 1991 anni
57.121
-1.893
-3.21%
1 gen 1992 anni
57.663
+0.542
0.95%
1 gen 1993 anni
57.463
-0.2
-0.35%
1 gen 1994 anni
57.625
+0.162
0.28%
1 gen 1995 anni
59.545
+1.921
3.33%
1 gen 1996 anni
77.703
+18.157
30.49%
1 gen 1997 anni
68.235
-9.467
-12.18%
1 gen 1998 anni
71.626
+3.39
4.97%
1 gen 1999 anni
72.425
+0.799
1.12%
1 gen 2000 anni
76.268
+3.843
5.31%
1 gen 2001 anni
73.642
-2.626
-3.44%
1 gen 2002 anni
78.654
+5.012
6.81%
1 gen 2003 anni
78.928
+0.274
0.35%
1 gen 2004 anni
76.389
-2.539
-3.22%
1 gen 2005 anni
79.658
+3.269
4.28%
1 gen 2006 anni
76.763
-2.895
-3.63%
1 gen 2007 anni
80.594
+3.832
4.99%
1 gen 2008 anni
68.454
-12.141
-15.06%
1 gen 2009 anni
72.773
+4.32
6.31%
1 gen 2010 anni
66.473
-6.3
-8.66%
1 gen 2011 anni
65.088
-1.385
-2.08%
1 gen 2012 anni
70.5
+5.412
8.31%
1 gen 2013 anni
72.813
+2.313
3.28%
1 gen 2014 anni
67.977
-4.836
-6.64%
Classificazione dei paesi secondo i statistiche attuali per anni


Commenti: