29
/it/
it
AIzaSyAYiBZKx7MnpbEhh9jyipgxe19OcubqV5w
April 1, 2024
178635
Liberia
LBR
true
2
1
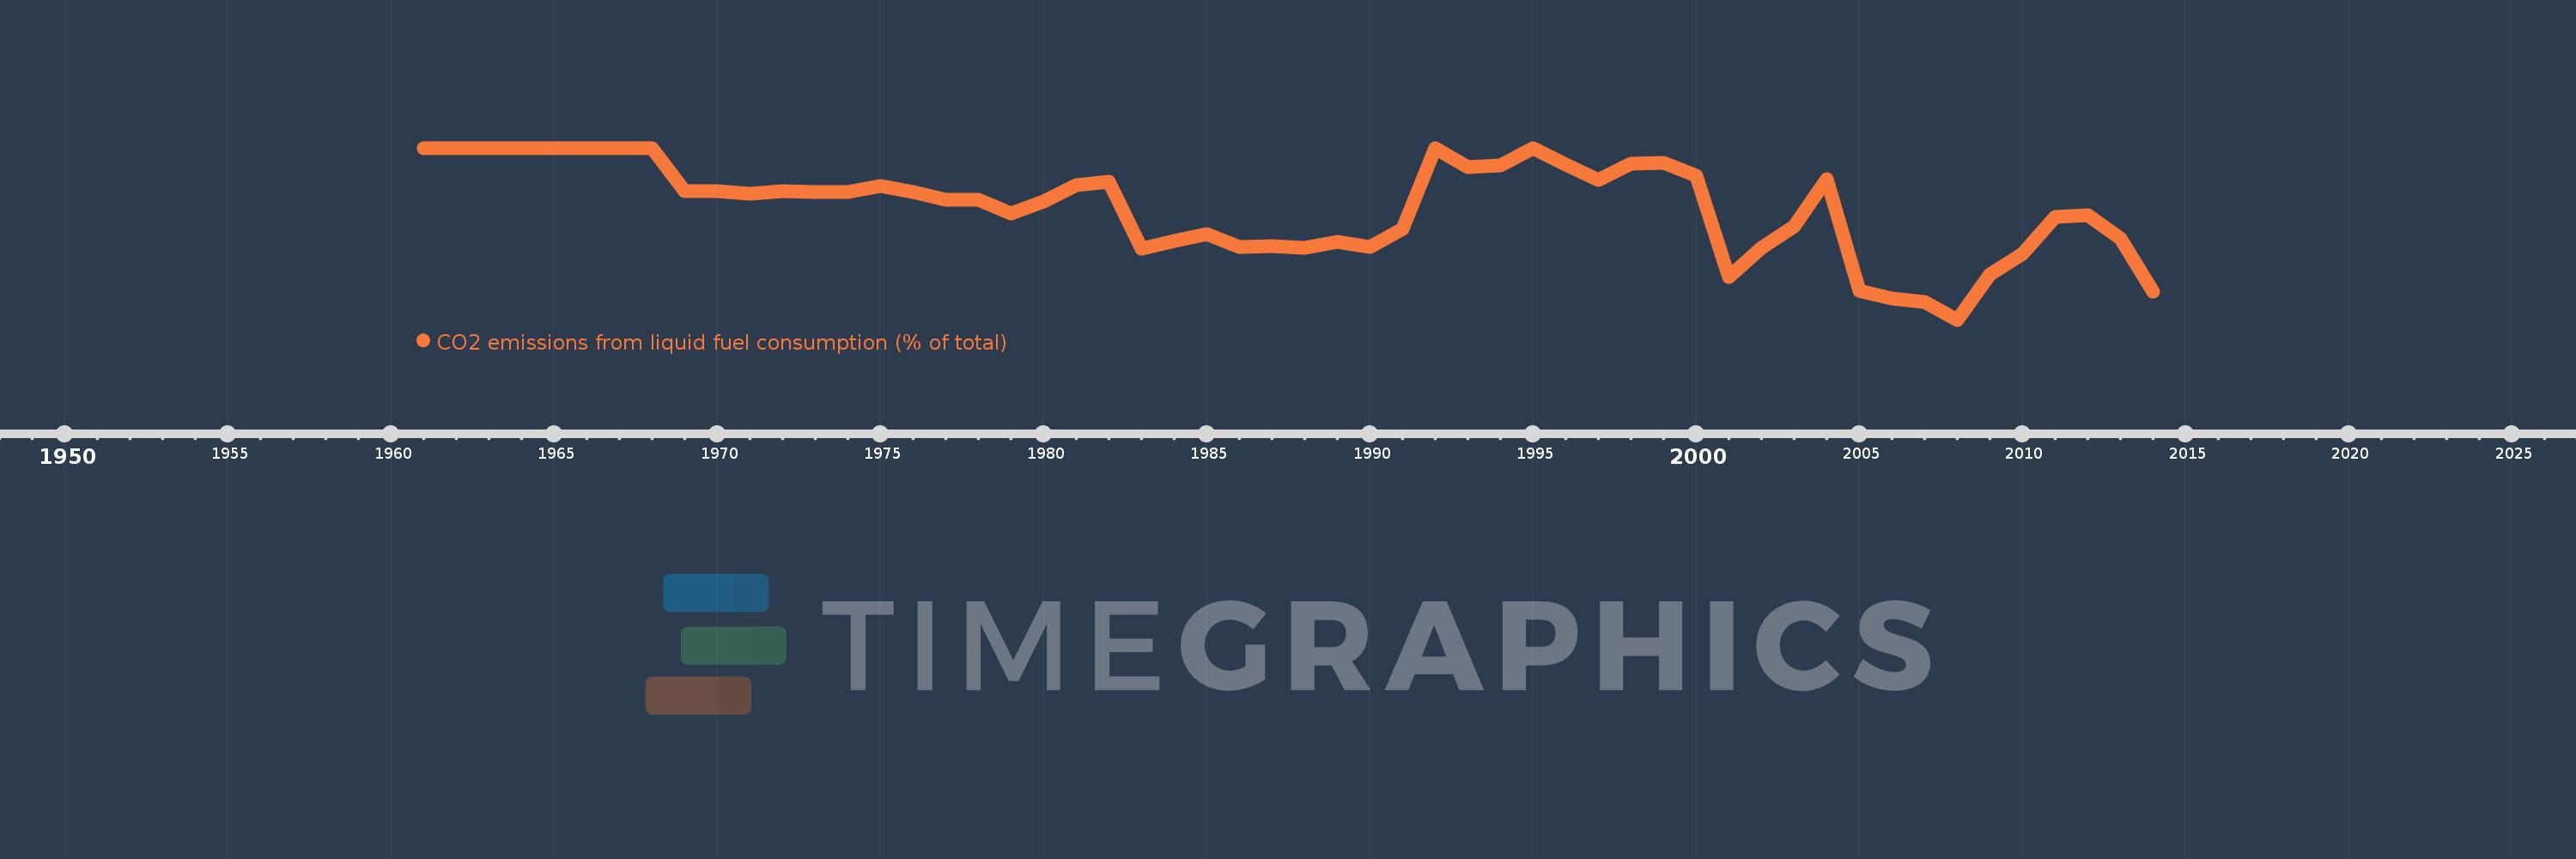
CO2 emissions from liquid fuel consumption (% of total)
2014,2013,2012,2011,2010,2009,2008,2007,2006,2005,2004,2003,2002,2001,2000,1999,1998,1997,1996,1995,1994,1993,1992,1991,1990,1989,1988,1987,1986,1985,1984,1983,1982,1981,1980,1979,1978,1977,1976,1975,1974,1973,1972,1971,1970,1969,1968,1967,1966,1965,1964,1963,1962,1961
Queste statistiche in altri paesi:
AfghanistanAlbaniaAlgeriaAndorraAngolaAntigua and BarbudaArab WorldArgentinaArmeniaArubaAustraliaAustriaAzerbaijanBahamas, TheBahrainBangladeshBarbadosBelarusBelgiumBelizeBeninBermudaBhutanBoliviaBosnia and HerzegovinaBotswanaBrazilBritish Virgin IslandsBrunei DarussalamBulgariaBurkina FasoBurundiCabo VerdeCambodiaCameroonCanadaCaribbean small statesCayman IslandsCentral African RepublicCentral Europe and the BalticsChadChileChinaColombiaComorosCongo, Dem. Rep.Congo, Rep.Costa RicaCote d'IvoireCroatiaCubaCuracaoCyprusCzech RepublicDenmarkDjiboutiDominicaDominican RepublicEarly-demographic dividendEast Asia & PacificEast Asia & Pacific (excluding high income)East Asia & Pacific (IDA & IBRD countries)EcuadorEgypt, Arab Rep.El SalvadorEquatorial GuineaEritreaEstoniaEthiopiaEuro areaEurope & Central AsiaEurope & Central Asia (excluding high income)Europe & Central Asia (IDA & IBRD countries)European UnionFaroe IslandsFijiFinlandFragile and conflict affected situationsFranceFrench PolynesiaGabonGambia, TheGeorgiaGermanyGhanaGibraltarGreeceGreenlandGrenadaGuatemalaGuineaGuinea-BissauGuyanaHaitiHeavily indebted poor countries (HIPC)High incomeHondurasHong Kong SAR, ChinaHungaryIBRD onlyIcelandIDA & IBRD totalIDA blendIDA onlyIDA totalIndiaIndonesiaIran, Islamic Rep.IraqIrelandIsraelItalyJamaicaJapanJordanKazakhstanKenyaKiribatiKorea, Dem. People’s Rep.Korea, Rep.KuwaitKyrgyz RepublicLao PDRLate-demographic dividendLatin America & Caribbean Latin America & Caribbean (excluding high income)Latin America & the Caribbean (IDA & IBRD countries)LatviaLeast developed countries: UN classificationLebanonLesothoLiberiaLibyaLiechtensteinLithuaniaLow & middle incomeLow incomeLower middle incomeLuxembourgMacao SAR, ChinaMacedonia, FYRMadagascarMalawiMalaysiaMaldivesMaliMaltaMarshall IslandsMauritaniaMauritiusMexicoMicronesia, Fed. Sts.Middle East & North AfricaMiddle East & North Africa (excluding high income)Middle East & North Africa (IDA & IBRD countries)Middle incomeMoldovaMongoliaMontenegroMoroccoMozambiqueMyanmarNamibiaNauruNepalNetherlandsNew CaledoniaNew ZealandNicaraguaNigerNigeriaNorth AmericaNorwayOECD membersOmanOther small statesPacific island small statesPakistanPalauPanamaPapua New GuineaParaguayPeruPhilippinesPolandPortugalPost-demographic dividendPre-demographic dividendQatarRomaniaRussian FederationRwandaSamoaSao Tome and PrincipeSaudi ArabiaSenegalSerbiaSeychellesSierra LeoneSingaporeSint Maarten (Dutch part)Slovak RepublicSloveniaSmall statesSolomon IslandsSomaliaSouth AfricaSouth AsiaSouth Asia (IDA & IBRD)South SudanSpainSri LankaSt. Kitts and NevisSt. LuciaSt. Vincent and the GrenadinesSub-Saharan Africa Sub-Saharan Africa (excluding high income)Sub-Saharan Africa (IDA & IBRD countries)SudanSurinameSwazilandSwedenSwitzerlandSyrian Arab RepublicTajikistanTanzaniaThailandTimor-LesteTogoTongaTrinidad and TobagoTunisiaTurkeyTurkmenistanTurks and Caicos IslandsUgandaUkraineUnited Arab EmiratesUnited KingdomUnited StatesUpper middle incomeUruguayUzbekistanVanuatuVenezuela, RBVietnamWest Bank and GazaWorldYemen, Rep.ZambiaZimbabwe Linea del tempo:
Questa scala temporale mostra un grafico dal 1961 anno al 2014 anno. Liberia. I dati fino ad 1960 anno non disponibili. Il numero di osservazioni attuali secondo i date: 54.
La fonte (nome):
Indicatori dello sviluppo mondiale
La fonte (organizzazione):
Carbon Dioxide Information Analysis Center, Environmental Sciences Division, Oak Ridge National Laboratory, Tennessee, United States.
Categorie:
Climate Change, Environment
sono stati aggiornati
23 apr 2017 anni
Indicatori delle variazioni dei valori per anni
Minima:
88.525
1 gen 2008 anni
Massimo:
100.0
1 gen 1961 anni
Alla data di osservazione
Valore
Variazione assoluta
La variazione rispetto al valore precedente
1 gen 1961 anni
100.0
+100.0
0.0%
1 gen 1962 anni
100.0
0.0
0.0%
1 gen 1963 anni
100.0
0.0
0.0%
1 gen 1964 anni
100.0
0.0
0.0%
1 gen 1965 anni
100.0
0.0
0.0%
1 gen 1966 anni
100.0
0.0
0.0%
1 gen 1967 anni
100.0
0.0
0.0%
1 gen 1968 anni
100.0
0.0
0.0%
1 gen 1969 anni
97.095
-2.905
-2.9%
1 gen 1970 anni
97.118
+0.023
0.02%
1 gen 1971 anni
96.97
-0.148
-0.15%
1 gen 1972 anni
97.115
+0.146
0.15%
1 gen 1973 anni
97.08
-0.035
-0.04%
1 gen 1974 anni
97.03
-0.051
-0.05%
1 gen 1975 anni
97.447
+0.417
0.43%
1 gen 1976 anni
97.037
-0.41
-0.42%
1 gen 1977 anni
96.526
-0.511
-0.53%
1 gen 1978 anni
96.517
-0.009
-0.01%
1 gen 1979 anni
95.62
-0.897
-0.93%
1 gen 1980 anni
96.422
+0.801
0.84%
1 gen 1981 anni
97.487
+1.065
1.1%
1 gen 1982 anni
97.732
+0.245
0.25%
1 gen 1983 anni
93.293
-4.439
-4.54%
1 gen 1984 anni
93.814
+0.522
0.56%
1 gen 1985 anni
94.241
+0.426
0.45%
1 gen 1986 anni
93.401
-0.84
-0.89%
1 gen 1987 anni
93.467
+0.066
0.07%
1 gen 1988 anni
93.301
-0.166
-0.18%
1 gen 1989 anni
93.722
+0.421
0.45%
1 gen 1990 anni
93.407
-0.315
-0.34%
1 gen 1991 anni
94.615
+1.209
1.29%
1 gen 1992 anni
100.0
+5.385
5.69%
1 gen 1993 anni
98.718
-1.282
-1.28%
1 gen 1994 anni
98.851
+0.133
0.13%
1 gen 1995 anni
100.0
+1.149
1.16%
1 gen 1996 anni
98.889
-1.111
-1.11%
1 gen 1997 anni
97.849
-1.039
-1.05%
1 gen 1998 anni
98.958
+1.109
1.13%
1 gen 1999 anni
99.029
+0.071
0.07%
1 gen 2000 anni
98.148
-0.881
-0.89%
1 gen 2001 anni
91.379
-6.769
-6.9%
1 gen 2002 anni
93.333
+1.954
2.14%
1 gen 2003 anni
94.776
+1.443
1.55%
1 gen 2004 anni
97.902
+3.126
3.3%
1 gen 2005 anni
90.476
-7.426
-7.59%
1 gen 2006 anni
89.95
-0.526
-0.58%
1 gen 2007 anni
89.706
-0.244
-0.27%
1 gen 2008 anni
88.525
-1.181
-1.32%
1 gen 2009 anni
91.558
+3.034
3.43%
1 gen 2010 anni
92.908
+1.349
1.47%
1 gen 2011 anni
95.392
+2.484
2.67%
1 gen 2012 anni
95.492
+0.1
0.1%
1 gen 2013 anni
93.95
-1.542
-1.61%
1 gen 2014 anni
90.421
-3.529
-3.76%
Classificazione dei paesi secondo i statistiche attuali per anni


Commenti: