29
/it/
it
AIzaSyAYiBZKx7MnpbEhh9jyipgxe19OcubqV5w
April 1, 2024
282633
Vietnam
VNM
true
2
1
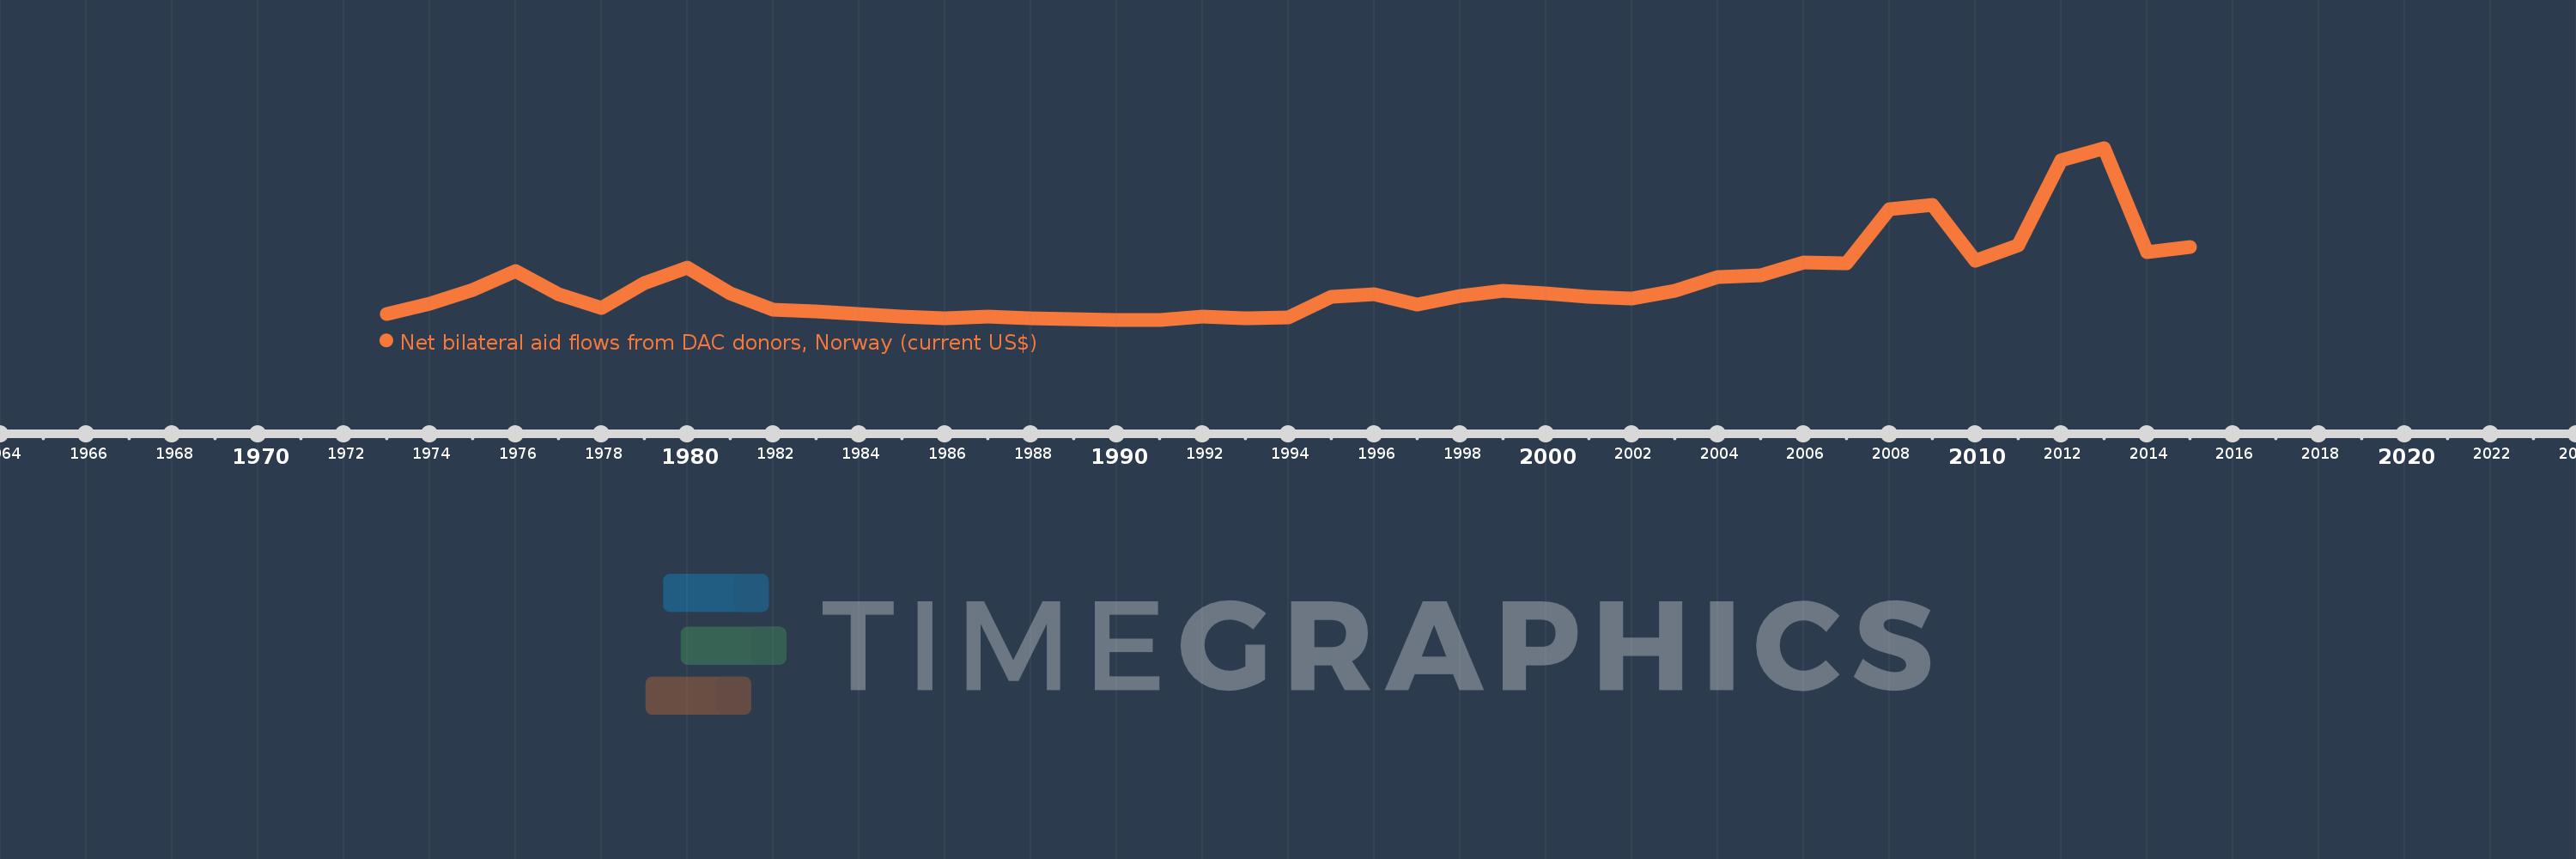
Net bilateral aid flows from DAC donors, Norway (current US$)
2015,2014,2013,2012,2011,2010,2009,2008,2007,2006,2005,2004,2003,2002,2001,2000,1999,1998,1997,1996,1995,1994,1993,1992,1991,1990,1989,1988,1987,1986,1985,1984,1983,1982,1981,1980,1979,1978,1977,1976,1975,1974,1973
Queste statistiche in altri paesi:
AfghanistanAlbaniaAlgeriaAngolaAntigua and BarbudaArab WorldArgentinaArmeniaAzerbaijanBahrainBangladeshBarbadosBelarusBelizeBeninBermudaBhutanBoliviaBosnia and HerzegovinaBotswanaBrazilBulgariaBurkina FasoBurundiCabo VerdeCambodiaCameroonCaribbean small statesCentral African RepublicCentral Europe and the BalticsChadChileChinaColombiaComorosCongo, Dem. Rep.Congo, Rep.Costa RicaCote d'IvoireCroatiaCubaCyprusCzech RepublicDjiboutiDominican RepublicEast Asia & PacificEast Asia & Pacific (excluding high income)East Asia & Pacific (IDA & IBRD countries)EcuadorEgypt, Arab Rep.El SalvadorEquatorial GuineaEritreaEstoniaEthiopiaEuro areaEurope & Central AsiaEurope & Central Asia (excluding high income)Europe & Central Asia (IDA & IBRD countries)European UnionFijiFragile and conflict affected situationsGabonGambia, TheGeorgiaGhanaGibraltarGrenadaGuatemalaGuineaGuinea-BissauGuyanaHaitiHeavily indebted poor countries (HIPC)High incomeHondurasHong Kong SAR, ChinaHungaryIBRD onlyIDA & IBRD totalIDA blendIDA onlyIDA totalIndiaIndonesiaIran, Islamic Rep.IraqIsraelJamaicaJordanKazakhstanKenyaKiribatiKorea, Dem. People’s Rep.Korea, Rep.KosovoKuwaitKyrgyz RepublicLao PDRLatin America & Caribbean Latin America & Caribbean (excluding high income)Latin America & the Caribbean (IDA & IBRD countries)LatviaLeast developed countries: UN classificationLebanonLesothoLiberiaLibyaLithuaniaLow & middle incomeLow incomeLower middle incomeMacao SAR, ChinaMacedonia, FYRMadagascarMalawiMalaysiaMaldivesMaliMaltaMarshall IslandsMauritaniaMauritiusMexicoMiddle East & North AfricaMiddle East & North Africa (excluding high income)Middle East & North Africa (IDA & IBRD countries)Middle incomeMoldovaMongoliaMontenegroMoroccoMozambiqueMyanmarNamibiaNauruNepalNicaraguaNigerNigeriaNorth AmericaOECD membersOmanOther small statesPacific island small statesPakistanPanamaPapua New GuineaParaguayPeruPhilippinesPolandRomaniaRussian FederationRwandaSamoaSao Tome and PrincipeSaudi ArabiaSenegalSerbiaSeychellesSierra LeoneSingaporeSlovak RepublicSloveniaSmall statesSolomon IslandsSomaliaSouth AfricaSouth AsiaSouth Asia (IDA & IBRD)South SudanSri LankaSt. Kitts and NevisSt. LuciaSt. Vincent and the GrenadinesSub-Saharan Africa Sub-Saharan Africa (excluding high income)Sub-Saharan Africa (IDA & IBRD countries)SudanSurinameSwazilandSyrian Arab RepublicTajikistanTanzaniaThailandTimor-LesteTogoTongaTrinidad and TobagoTunisiaTurkeyTurkmenistanUgandaUkraineUnited Arab EmiratesUpper middle incomeUruguayUzbekistanVanuatuVenezuela, RBVietnamWest Bank and GazaWorldYemen, Rep.ZambiaZimbabwe Linea del tempo:
Questa scala temporale mostra un grafico dal 1973 anno al 2015 anno. Vietnam. I dati fino ad 1972 anno non disponibili. Il numero di osservazioni attuali secondo i date: 43.
La fonte (nome):
Indicatori dello sviluppo mondiale
La fonte (organizzazione):
Development Assistance Committee of the Organisation for Economic Co-operation and Development, Geographical Distribution of Financial Flows to Developing Countries, Development Co-operation Report, and International Development Statistics database. Data are available online at: www.oecd.org/dac/stats/idsonline.
Categorie:
Aid Effectiveness
sono stati aggiornati
23 apr 2017 anni
Indicatori delle variazioni dei valori per anni
Minima:
30.0 Mille.
1 gen 1990 anni
Massimo:
46.44 Mln
1 gen 2013 anni
Alla data di osservazione
Valore
Variazione assoluta
La variazione rispetto al valore precedente
1 gen 1973 anni
1.51 Mln
+1.51 Mln
0.0%
1 gen 1974 anni
4.37 Mln
+2.86 Mln
189.4%
1 gen 1975 anni
8.12 Mln
+3.75 Mln
85.81%
1 gen 1976 anni
13.08 Mln
+4.96 Mln
61.08%
1 gen 1977 anni
6.88 Mln
-6.2 Mln
-47.4%
1 gen 1978 anni
3.3 Mln
-3.58 Mln
-52.03%
1 gen 1979 anni
9.89 Mln
+6.59 Mln
199.7%
1 gen 1980 anni
14.12 Mln
+4.23 Mln
42.77%
1 gen 1981 anni
7.24 Mln
-6.88 Mln
-48.73%
1 gen 1982 anni
2.69 Mln
-4.55 Mln
-62.85%
1 gen 1983 anni
2.33 Mln
-360.0 Mille.
-13.38%
1 gen 1984 anni
1.59 Mln
-740.0 Mille.
-31.76%
1 gen 1985 anni
910.0 Mille.
-680.0 Mille.
-42.77%
1 gen 1986 anni
400.0 Mille.
-510.0 Mille.
-56.04%
1 gen 1987 anni
830.0 Mille.
+430.0 Mille.
107.5%
1 gen 1988 anni
350.0 Mille.
-480.0 Mille.
-57.83%
1 gen 1989 anni
200.0 Mille.
-150.0 Mille.
-42.86%
1 gen 1990 anni
30.0 Mille.
-170.0 Mille.
-85.0%
1 gen 1991 anni
60.0 Mille.
+30.0 Mille.
100.0%
1 gen 1992 anni
780.0 Mille.
+720.0 Mille.
1.2 Mille.%
1 gen 1993 anni
460.0 Mille.
-320.0 Mille.
-41.03%
1 gen 1994 anni
760.0 Mille.
+300.0 Mille.
65.22%
1 gen 1995 anni
6.12 Mln
+5.36 Mln
705.26%
1 gen 1996 anni
6.85 Mln
+730.0 Mille.
11.93%
1 gen 1997 anni
4.18 Mln
-2.67 Mln
-38.98%
1 gen 1998 anni
6.48 Mln
+2.3 Mln
55.02%
1 gen 1999 anni
7.91 Mln
+1.43 Mln
22.07%
1 gen 2000 anni
7.13 Mln
-780.0 Mille.
-9.86%
1 gen 2001 anni
6.17 Mln
-960.0 Mille.
-13.46%
1 gen 2002 anni
5.69 Mln
-480.0 Mille.
-7.78%
1 gen 2003 anni
7.94 Mln
+2.25 Mln
39.54%
1 gen 2004 anni
11.53 Mln
+3.59 Mln
45.21%
1 gen 2005 anni
12.05 Mln
+520.0 Mille.
4.51%
1 gen 2006 anni
15.45 Mln
+3.4 Mln
28.22%
1 gen 2007 anni
15.21 Mln
-240.0 Mille.
-1.55%
1 gen 2008 anni
29.98 Mln
+14.77 Mln
97.11%
1 gen 2009 anni
30.94 Mln
+960.0 Mille.
3.2%
1 gen 2010 anni
15.9 Mln
-15.04 Mln
-48.61%
1 gen 2011 anni
20.18 Mln
+4.28 Mln
26.92%
1 gen 2012 anni
43.12 Mln
+22.94 Mln
113.68%
1 gen 2013 anni
46.44 Mln
+3.32 Mln
7.7%
1 gen 2014 anni
18.39 Mln
-28.05 Mln
-60.4%
1 gen 2015 anni
19.8 Mln
+1.41 Mln
7.67%
Classificazione dei paesi secondo i statistiche attuali per anni


Commenti: