29
/it/
it
AIzaSyAYiBZKx7MnpbEhh9jyipgxe19OcubqV5w
April 1, 2024
188142
Malaysia
MYS
true
2
1
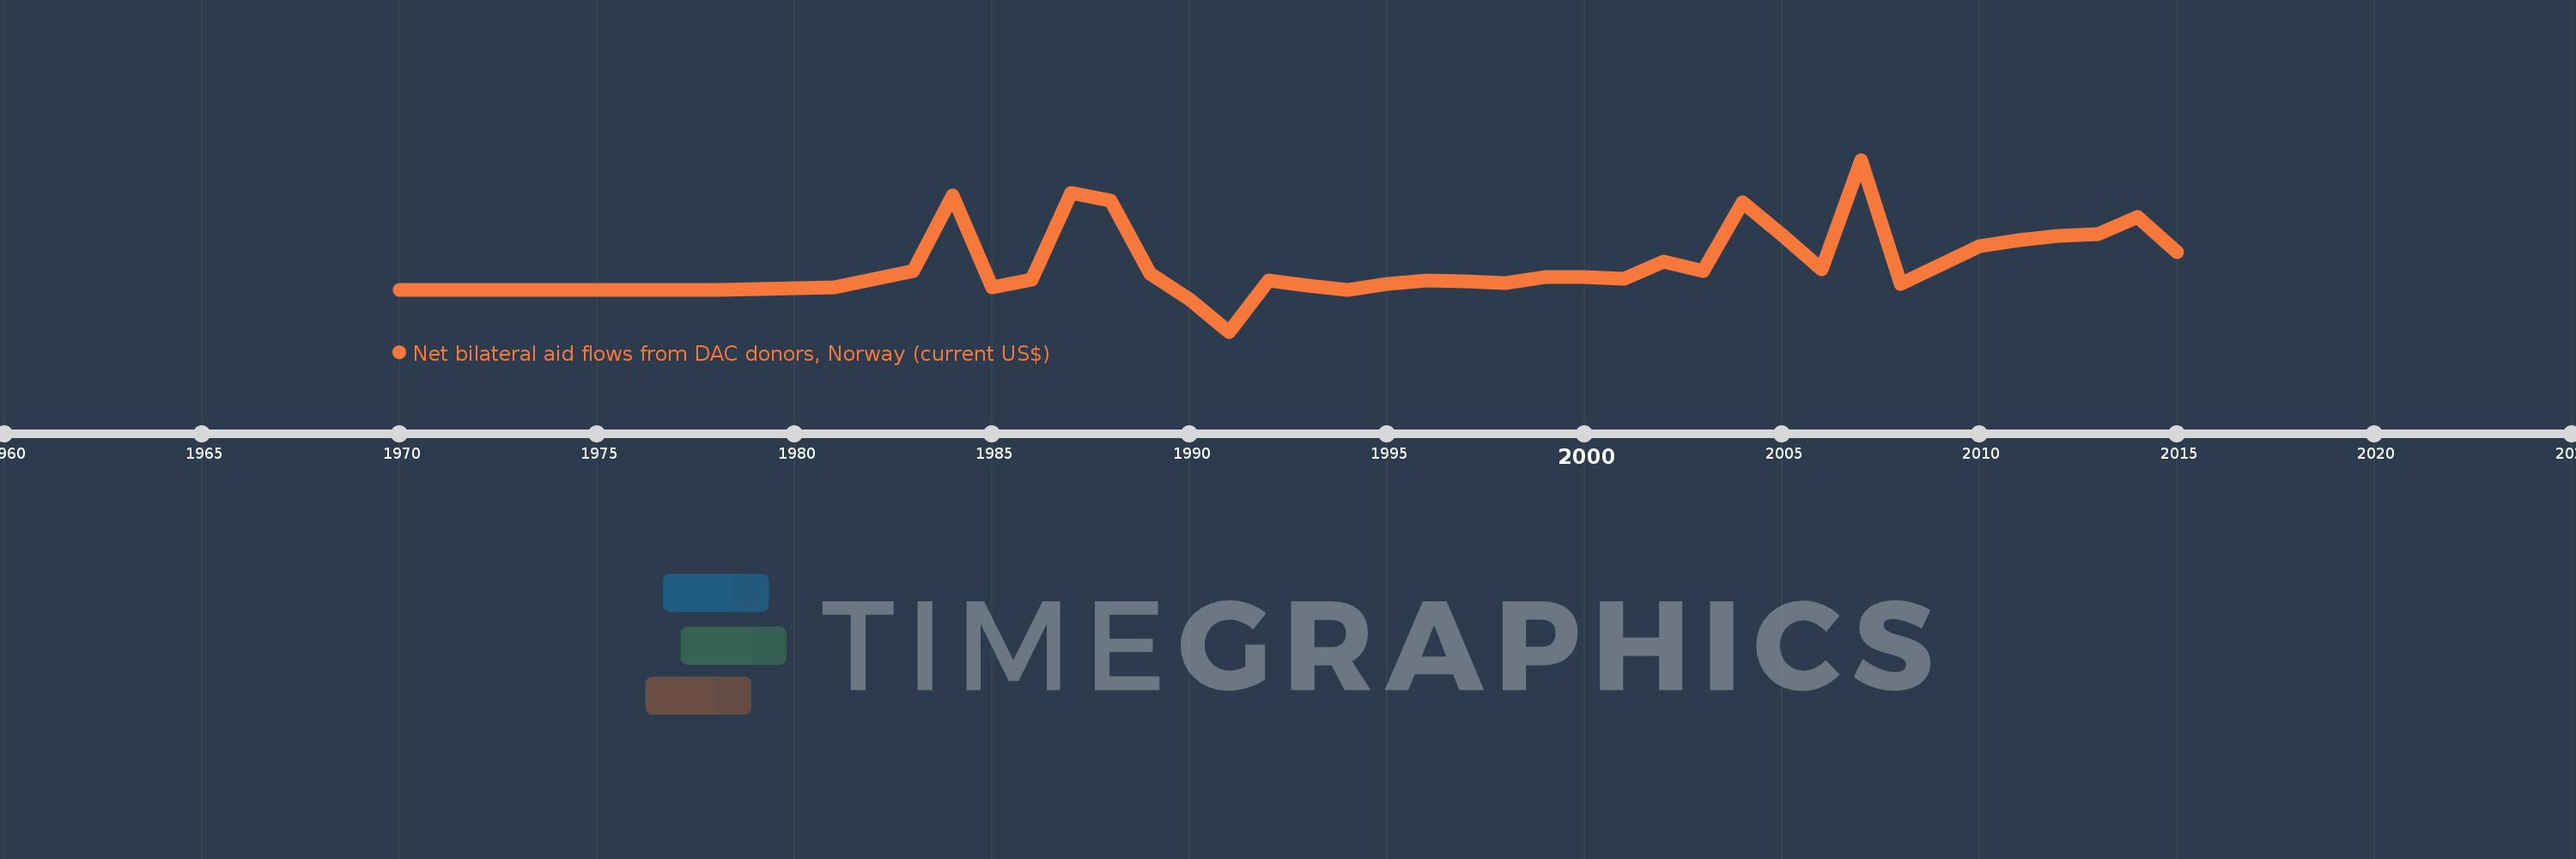
Net bilateral aid flows from DAC donors, Norway (current US$)
2015,2014,2013,2012,2011,2010,2009,2008,2007,2006,2005,2004,2003,2002,2001,2000,1999,1998,1997,1996,1995,1994,1993,1992,1991,1990,1989,1988,1987,1986,1985,1984,1983,1981,1978,1975,1974,1970
Queste statistiche in altri paesi:
AfghanistanAlbaniaAlgeriaAngolaAntigua and BarbudaArab WorldArgentinaArmeniaAzerbaijanBahrainBangladeshBarbadosBelarusBelizeBeninBermudaBhutanBoliviaBosnia and HerzegovinaBotswanaBrazilBulgariaBurkina FasoBurundiCabo VerdeCambodiaCameroonCaribbean small statesCentral African RepublicCentral Europe and the BalticsChadChileChinaColombiaComorosCongo, Dem. Rep.Congo, Rep.Costa RicaCote d'IvoireCroatiaCubaCyprusCzech RepublicDjiboutiDominican RepublicEast Asia & PacificEast Asia & Pacific (excluding high income)East Asia & Pacific (IDA & IBRD countries)EcuadorEgypt, Arab Rep.El SalvadorEquatorial GuineaEritreaEstoniaEthiopiaEuro areaEurope & Central AsiaEurope & Central Asia (excluding high income)Europe & Central Asia (IDA & IBRD countries)European UnionFijiFragile and conflict affected situationsGabonGambia, TheGeorgiaGhanaGibraltarGrenadaGuatemalaGuineaGuinea-BissauGuyanaHaitiHeavily indebted poor countries (HIPC)High incomeHondurasHong Kong SAR, ChinaHungaryIBRD onlyIDA & IBRD totalIDA blendIDA onlyIDA totalIndiaIndonesiaIran, Islamic Rep.IraqIsraelJamaicaJordanKazakhstanKenyaKiribatiKorea, Dem. People’s Rep.Korea, Rep.KosovoKuwaitKyrgyz RepublicLao PDRLatin America & Caribbean Latin America & Caribbean (excluding high income)Latin America & the Caribbean (IDA & IBRD countries)LatviaLeast developed countries: UN classificationLebanonLesothoLiberiaLibyaLithuaniaLow & middle incomeLow incomeLower middle incomeMacao SAR, ChinaMacedonia, FYRMadagascarMalawiMalaysiaMaldivesMaliMaltaMarshall IslandsMauritaniaMauritiusMexicoMiddle East & North AfricaMiddle East & North Africa (excluding high income)Middle East & North Africa (IDA & IBRD countries)Middle incomeMoldovaMongoliaMontenegroMoroccoMozambiqueMyanmarNamibiaNauruNepalNicaraguaNigerNigeriaNorth AmericaOECD membersOmanOther small statesPacific island small statesPakistanPanamaPapua New GuineaParaguayPeruPhilippinesPolandRomaniaRussian FederationRwandaSamoaSao Tome and PrincipeSaudi ArabiaSenegalSerbiaSeychellesSierra LeoneSingaporeSlovak RepublicSloveniaSmall statesSolomon IslandsSomaliaSouth AfricaSouth AsiaSouth Asia (IDA & IBRD)South SudanSri LankaSt. Kitts and NevisSt. LuciaSt. Vincent and the GrenadinesSub-Saharan Africa Sub-Saharan Africa (excluding high income)Sub-Saharan Africa (IDA & IBRD countries)SudanSurinameSwazilandSyrian Arab RepublicTajikistanTanzaniaThailandTimor-LesteTogoTongaTrinidad and TobagoTunisiaTurkeyTurkmenistanUgandaUkraineUnited Arab EmiratesUpper middle incomeUruguayUzbekistanVanuatuVenezuela, RBVietnamWest Bank and GazaWorldYemen, Rep.ZambiaZimbabwe Linea del tempo:
Questa scala temporale mostra un grafico dal 1970 anno al 2015 anno. Malaysia. I dati fino ad 1969 anno non disponibili. Il numero di osservazioni attuali secondo i date: 38.
La fonte (nome):
Indicatori dello sviluppo mondiale
La fonte (organizzazione):
Development Assistance Committee of the Organisation for Economic Co-operation and Development, Geographical Distribution of Financial Flows to Developing Countries, Development Co-operation Report, and International Development Statistics database. Data are available online at: www.oecd.org/dac/stats/idsonline.
Categorie:
Aid Effectiveness
sono stati aggiornati
23 apr 2017 anni
Indicatori delle variazioni dei valori per anni
Minima:
-620.0 Mille.
1 gen 1991 anni
Massimo:
2.0 Mln
1 gen 2007 anni
Alla data di osservazione
Valore
Variazione assoluta
La variazione rispetto al valore precedente
1 gen 1970 anni
10.0 Mille.
+10.0 Mille.
0.0%
1 gen 1974 anni
10.0 Mille.
0.0
0.0%
1 gen 1975 anni
10.0 Mille.
0.0
0.0%
1 gen 1978 anni
20.0 Mille.
+10.0 Mille.
100.0%
1 gen 1981 anni
50.0 Mille.
+30.0 Mille.
150.0%
1 gen 1983 anni
310.0 Mille.
+260.0 Mille.
520.0%
1 gen 1984 anni
1.45 Mln
+1.14 Mln
367.74%
1 gen 1985 anni
60.0 Mille.
-1.39 Mln
-95.86%
1 gen 1986 anni
170.0 Mille.
+110.0 Mille.
183.33%
1 gen 1987 anni
1.49 Mln
+1.32 Mln
776.47%
1 gen 1988 anni
1.38 Mln
-110.0 Mille.
-7.38%
1 gen 1989 anni
270.0 Mille.
-1.11 Mln
-80.43%
1 gen 1990 anni
-130.0 Mille.
-400.0 Mille.
-148.15%
1 gen 1991 anni
-620.0 Mille.
-490.0 Mille.
376.92%
1 gen 1992 anni
160.0 Mille.
+780.0 Mille.
-125.81%
1 gen 1993 anni
80.0 Mille.
-80.0 Mille.
-50.0%
1 gen 1994 anni
20.0 Mille.
-60.0 Mille.
-75.0%
1 gen 1995 anni
110.0 Mille.
+90.0 Mille.
450.0%
1 gen 1996 anni
160.0 Mille.
+50.0 Mille.
45.45%
1 gen 1997 anni
140.0 Mille.
-20.0 Mille.
-12.5%
1 gen 1998 anni
120.0 Mille.
-20.0 Mille.
-14.29%
1 gen 1999 anni
210.0 Mille.
+90.0 Mille.
75.0%
1 gen 2000 anni
210.0 Mille.
0.0
0.0%
1 gen 2001 anni
190.0 Mille.
-20.0 Mille.
-9.52%
1 gen 2002 anni
450.0 Mille.
+260.0 Mille.
136.84%
1 gen 2003 anni
300.0 Mille.
-150.0 Mille.
-33.33%
1 gen 2004 anni
1.35 Mln
+1.05 Mln
350.0%
1 gen 2005 anni
860.0 Mille.
-490.0 Mille.
-36.3%
1 gen 2006 anni
330.0 Mille.
-530.0 Mille.
-61.63%
1 gen 2007 anni
2.0 Mln
+1.67 Mln
506.06%
1 gen 2008 anni
110.0 Mille.
-1.89 Mln
-94.5%
1 gen 2009 anni
390.0 Mille.
+280.0 Mille.
254.55%
1 gen 2010 anni
690.0 Mille.
+300.0 Mille.
76.92%
1 gen 2011 anni
770.0 Mille.
+80.0 Mille.
11.59%
1 gen 2012 anni
840.0 Mille.
+70.0 Mille.
9.09%
1 gen 2013 anni
870.0 Mille.
+30.0 Mille.
3.57%
1 gen 2014 anni
1.13 Mln
+260.0 Mille.
29.89%
1 gen 2015 anni
590.0 Mille.
-540.0 Mille.
-47.79%
Classificazione dei paesi secondo i statistiche attuali per anni


Commenti: