29
/it/
it
AIzaSyAYiBZKx7MnpbEhh9jyipgxe19OcubqV5w
April 1, 2024
277844
Uruguay
URY
true
2
1
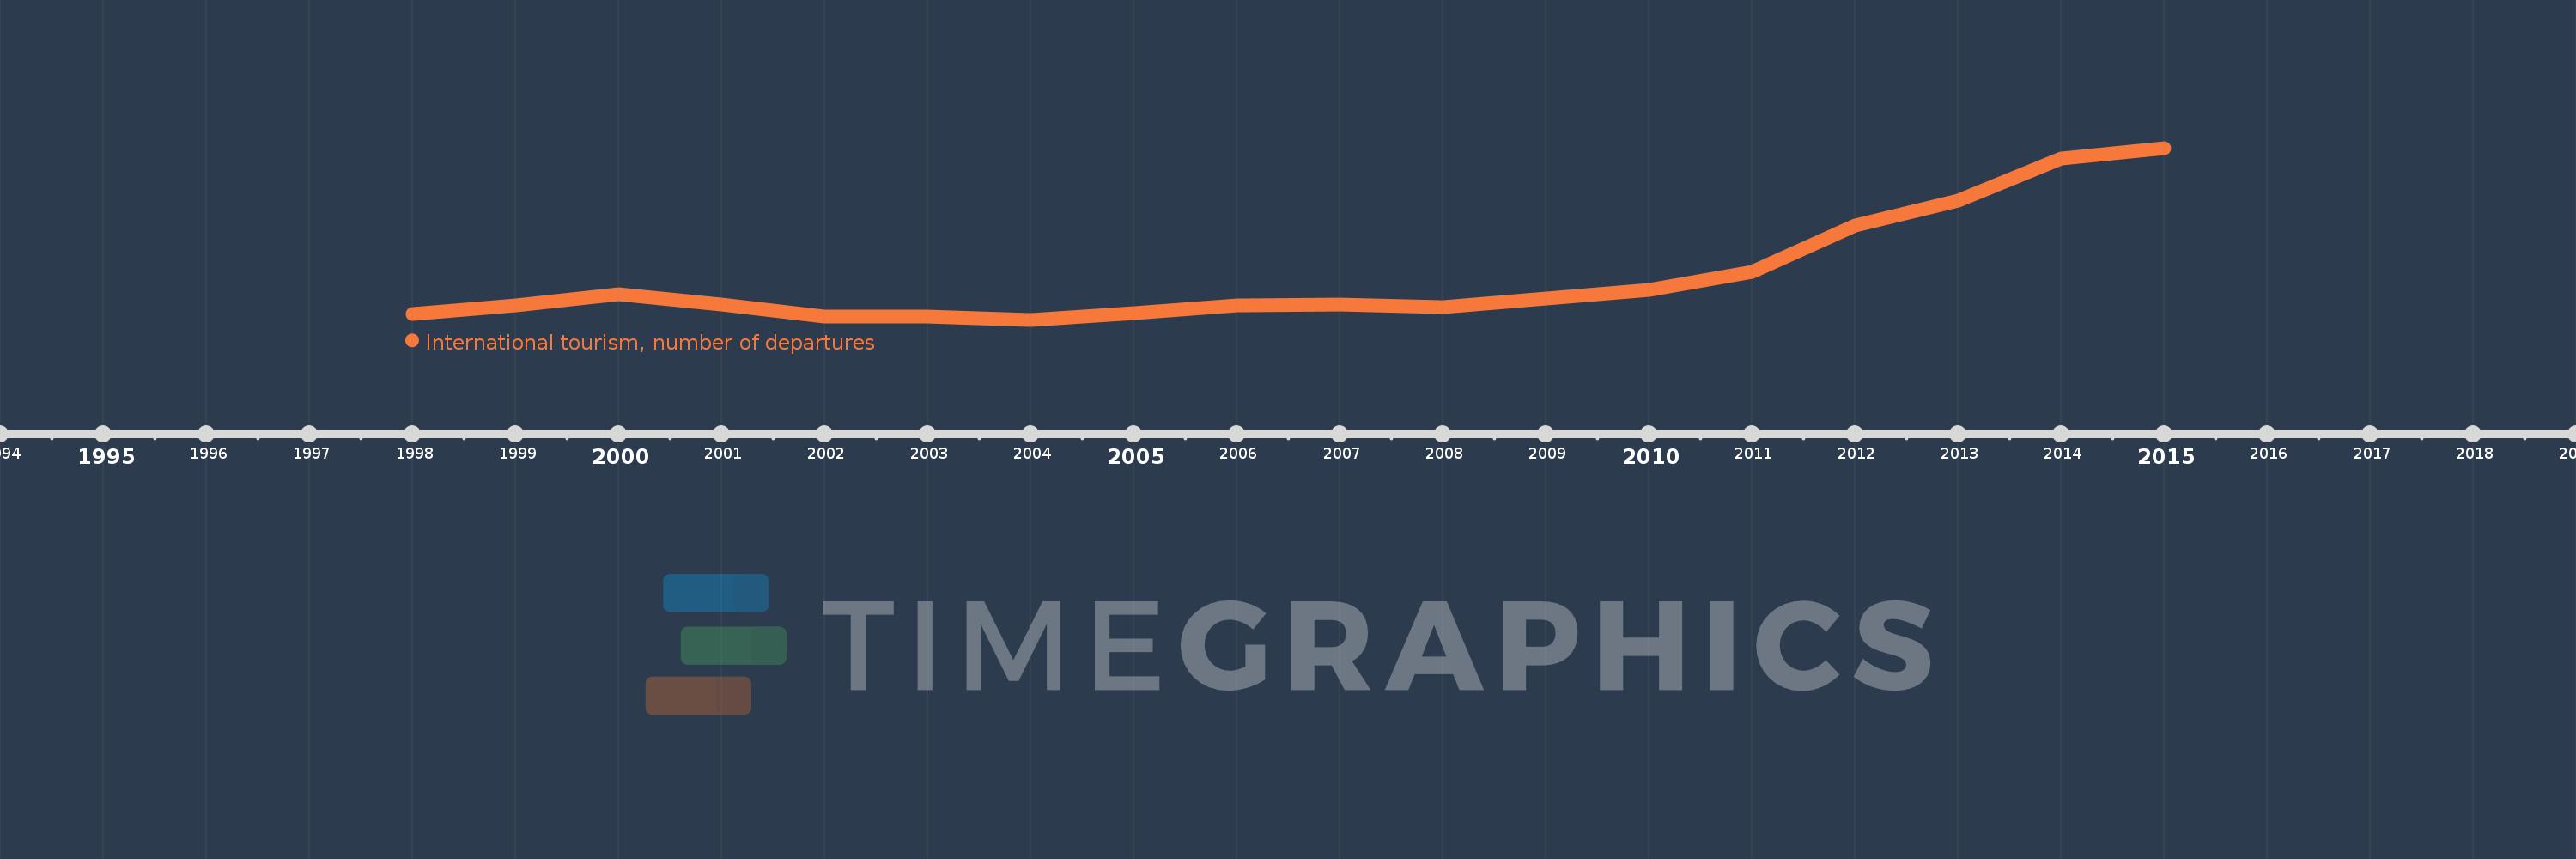
International tourism, number of departures
2015,2014,2013,2012,2011,2010,2009,2008,2007,2006,2005,2004,2003,2002,2001,2000,1999,1998
Queste statistiche in altri paesi:
Linea del tempo:
Questa scala temporale mostra un grafico dal 1998 anno al 2015 anno. Uruguay. I dati fino ad 1997 anno non disponibili. Il numero di osservazioni attuali secondo i date: 18.
La fonte (nome):
Indicatori dello sviluppo mondiale
La fonte (organizzazione):
World Tourism Organization, Yearbook of Tourism Statistics, Compendium of Tourism Statistics and data files.
Categorie:
Private Sector, Trade
sono stati aggiornati
23 apr 2017 anni
Indicatori delle variazioni dei valori per anni
Minima:
495.0 Mille.
1 gen 2004 anni
Massimo:
2.396 Mln
1 gen 2015 anni
Alla data di osservazione
Valore
Variazione assoluta
La variazione rispetto al valore precedente
1 gen 1998 anni
562.0 Mille.
+562.0 Mille.
0.0%
1 gen 1999 anni
654.0 Mille.
+92.0 Mille.
16.37%
1 gen 2000 anni
778.0 Mille.
+124.0 Mille.
18.96%
1 gen 2001 anni
667.0 Mille.
-111.0 Mille.
-14.27%
1 gen 2002 anni
531.0 Mille.
-136.0 Mille.
-20.39%
1 gen 2003 anni
530.0 Mille.
-1000.0
-0.19%
1 gen 2004 anni
495.0 Mille.
-35.0 Mille.
-6.6%
1 gen 2005 anni
569.0 Mille.
+74.0 Mille.
14.95%
1 gen 2006 anni
658.0 Mille.
+89.0 Mille.
15.64%
1 gen 2007 anni
666.0 Mille.
+8.0 Mille.
1.22%
1 gen 2008 anni
635.0 Mille.
-31.0 Mille.
-4.65%
1 gen 2009 anni
734.0 Mille.
+99.0 Mille.
15.59%
1 gen 2010 anni
826.0 Mille.
+92.0 Mille.
12.53%
1 gen 2011 anni
1.027 Mln
+201.0 Mille.
24.33%
1 gen 2012 anni
1.534 Mln
+507.0 Mille.
49.37%
1 gen 2013 anni
1.816 Mln
+282.0 Mille.
18.38%
1 gen 2014 anni
2.281 Mln
+465.0 Mille.
25.61%
1 gen 2015 anni
2.396 Mln
+115.0 Mille.
5.04%
Classificazione dei paesi secondo i statistiche attuali per anni


Commenti: