29
/it/
it
AIzaSyAYiBZKx7MnpbEhh9jyipgxe19OcubqV5w
April 1, 2024
232370
Samoa
WSM
true
2
1
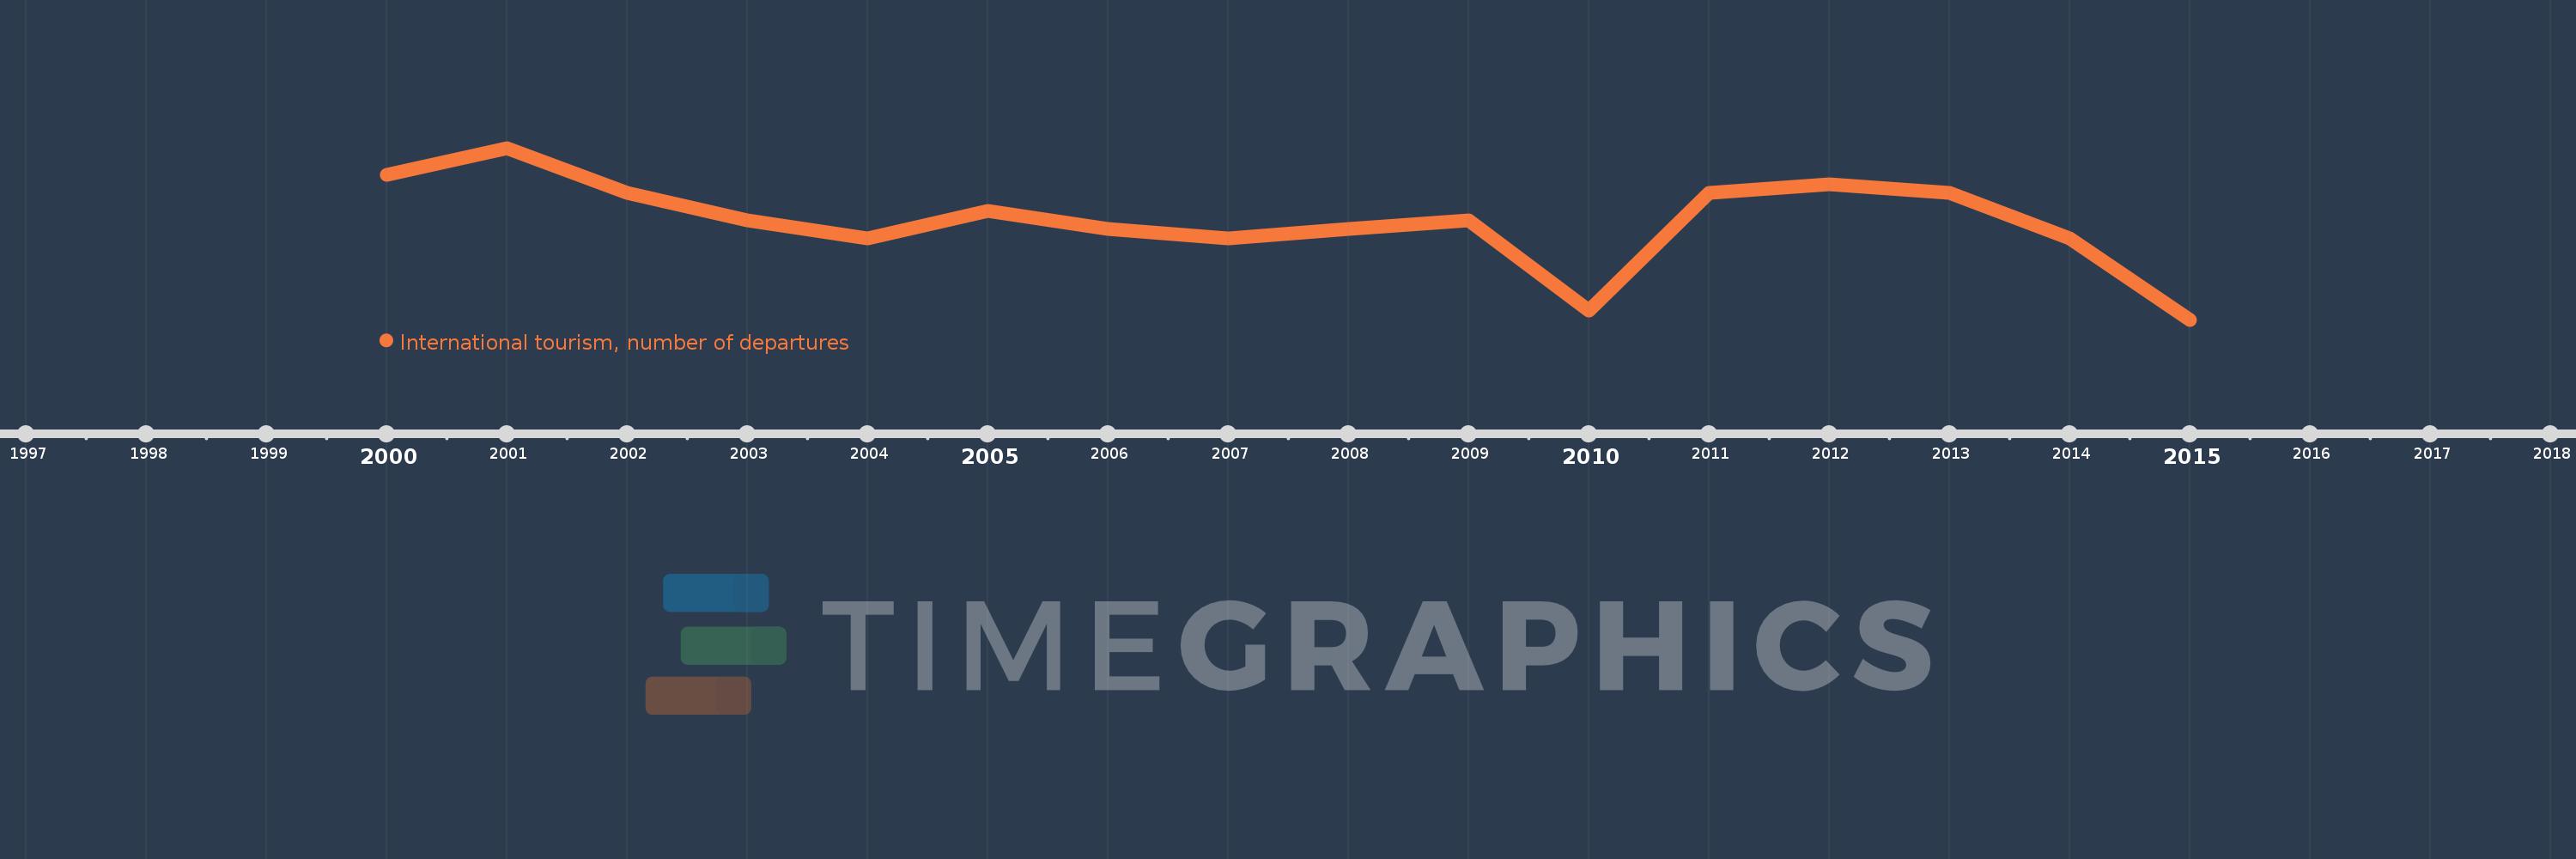
International tourism, number of departures
2015,2014,2013,2012,2011,2010,2009,2008,2007,2006,2005,2004,2003,2002,2001,2000
Queste statistiche in altri paesi:
Linea del tempo:
Questa scala temporale mostra un grafico dal 2000 anno al 2015 anno. Samoa. I dati fino ad 1999 anno non disponibili. Il numero di osservazioni attuali secondo i date: 16.
La fonte (nome):
Indicatori dello sviluppo mondiale
La fonte (organizzazione):
World Tourism Organization, Yearbook of Tourism Statistics, Compendium of Tourism Statistics and data files.
Categorie:
Private Sector, Trade
sono stati aggiornati
23 apr 2017 anni
Indicatori delle variazioni dei valori per anni
Minima:
42.0 Mille.
1 gen 2015 anni
Massimo:
61.0 Mille.
1 gen 2001 anni
Alla data di osservazione
Valore
Variazione assoluta
La variazione rispetto al valore precedente
1 gen 2000 anni
58.0 Mille.
+58.0 Mille.
0.0%
1 gen 2001 anni
61.0 Mille.
+3.0 Mille.
5.17%
1 gen 2002 anni
56.0 Mille.
-5.0 Mille.
-8.2%
1 gen 2003 anni
53.0 Mille.
-3.0 Mille.
-5.36%
1 gen 2004 anni
51.0 Mille.
-2.0 Mille.
-3.77%
1 gen 2005 anni
54.0 Mille.
+3.0 Mille.
5.88%
1 gen 2006 anni
52.0 Mille.
-2.0 Mille.
-3.7%
1 gen 2007 anni
51.0 Mille.
-1000.0
-1.92%
1 gen 2008 anni
52.0 Mille.
+1000.0
1.96%
1 gen 2009 anni
53.0 Mille.
+1000.0
1.92%
1 gen 2010 anni
43.0 Mille.
-10.0 Mille.
-18.87%
1 gen 2011 anni
56.0 Mille.
+13.0 Mille.
30.23%
1 gen 2012 anni
57.0 Mille.
+1000.0
1.79%
1 gen 2013 anni
56.0 Mille.
-1000.0
-1.75%
1 gen 2014 anni
51.0 Mille.
-5.0 Mille.
-8.93%
1 gen 2015 anni
42.0 Mille.
-9.0 Mille.
-17.65%
Classificazione dei paesi secondo i statistiche attuali per anni


Commenti: