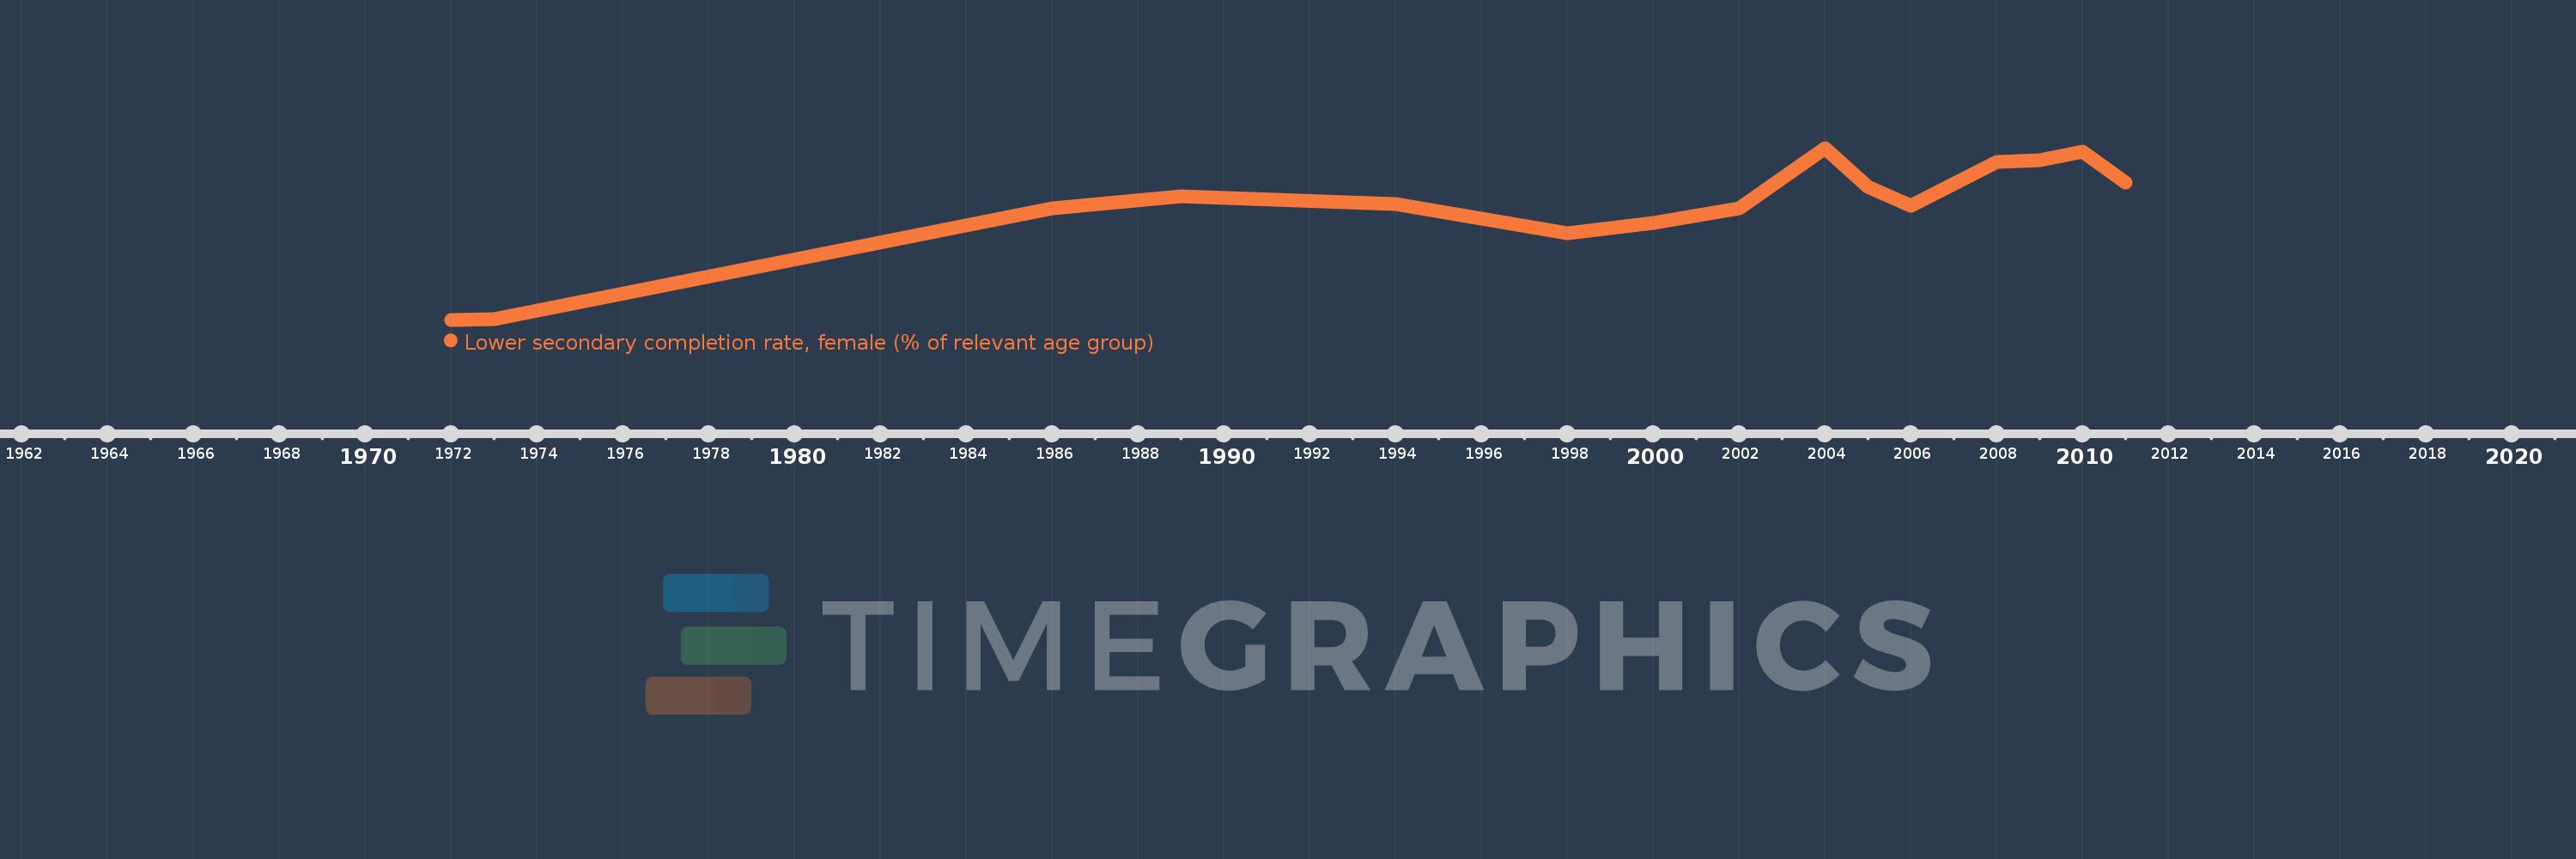
Questa scala temporale mostra un grafico dal 1972 anno al 2011 anno. Trinidad and Tobago. I dati fino ad 1971 anno non disponibili. Il numero di osservazioni attuali secondo i date: 15.
La fonte (nome):
Indicatori dello sviluppo mondiale
La fonte (organizzazione):
United Nations Educational, Scientific, and Cultural Organization (UNESCO) Institute for Statistics.
Categorie:
Education
sono stati aggiornati
23 apr 2017 anni
Indicatori delle variazioni dei valori per anni
In media:
77.64
Minima:
40.745
1 gen 1972 anni
Massimo:
97.119
1 gen 2004 anni
Alla data di osservazione
Valore
Variazione assoluta
La variazione rispetto al valore precedente
1 gen 1972 anni
40.745
+40.745
0.0%
1 gen 1973 anni
41.028
+0.283
0.7%
1 gen 1986 anni
77.423
+36.395
88.71%
1 gen 1989 anni
81.235
+3.812
4.92%
1 gen 1994 anni
78.635
-2.6
-3.2%
1 gen 1998 anni
69.251
-9.384
-11.93%
1 gen 2000 anni
72.386
+3.134
4.53%
1 gen 2002 anni
77.177
+4.792
6.62%
1 gen 2004 anni
97.119
+19.941
25.84%
1 gen 2005 anni
84.457
-12.662
-13.04%
1 gen 2006 anni
78.057
-6.4
-7.58%
1 gen 2008 anni
92.4
+14.344
18.38%
1 gen 2009 anni
93.158
+0.758
0.82%
1 gen 2010 anni
95.895
+2.737
2.94%
1 gen 2011 anni
85.626
-10.269
-10.71%
Classificazione dei paesi secondo i statistiche attuali per anni
