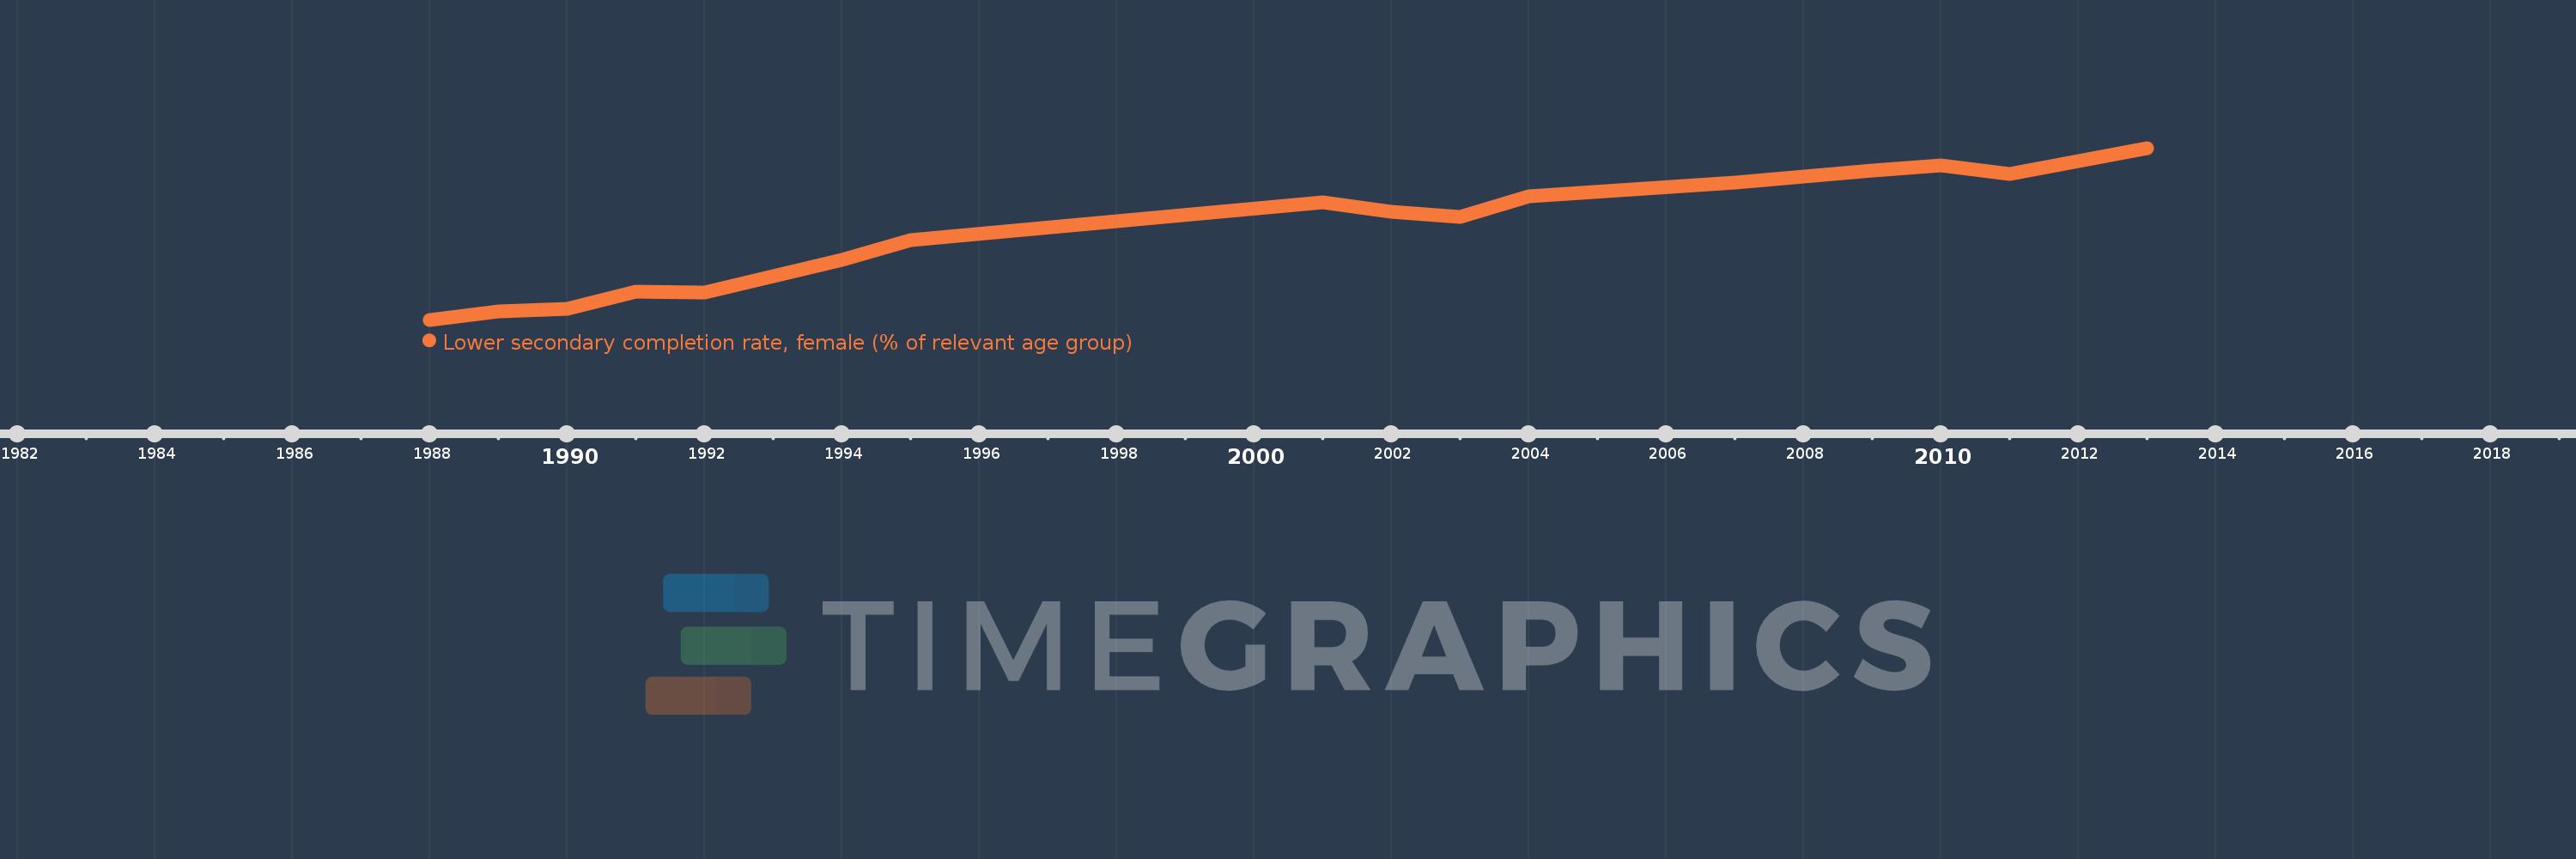
Questa scala temporale mostra un grafico dal 1988 anno al 2013 anno. Iran, Islamic Rep.. I dati fino ad 1987 anno non disponibili. Il numero di osservazioni attuali secondo i date: 17.
La fonte (nome):
Indicatori dello sviluppo mondiale
La fonte (organizzazione):
United Nations Educational, Scientific, and Cultural Organization (UNESCO) Institute for Statistics.
Categorie:
Education
sono stati aggiornati
23 apr 2017 anni
Indicatori delle variazioni dei valori per anni
In media:
69.73
Minima:
37.571
1 gen 1988 anni
Massimo:
96.931
1 gen 2013 anni
Alla data di osservazione
Valore
Variazione assoluta
La variazione rispetto al valore precedente
1 gen 1988 anni
37.571
+37.571
0.0%
1 gen 1989 anni
40.524
+2.954
7.86%
1 gen 1990 anni
41.343
+0.819
2.02%
1 gen 1991 anni
47.32
+5.977
14.46%
1 gen 1992 anni
46.858
-0.462
-0.98%
1 gen 1994 anni
58.132
+11.274
24.06%
1 gen 1995 anni
65.113
+6.981
12.01%
1 gen 2001 anni
78.242
+13.129
20.16%
1 gen 2002 anni
75.001
-3.241
-4.14%
1 gen 2003 anni
73.01
-1.991
-2.65%
1 gen 2004 anni
80.194
+7.183
9.84%
1 gen 2007 anni
85.093
+4.899
6.11%
1 gen 2009 anni
89.07
+3.977
4.67%
1 gen 2010 anni
90.833
+1.763
1.98%
1 gen 2011 anni
87.849
-2.984
-3.29%
1 gen 2012 anni
92.334
+4.486
5.11%
1 gen 2013 anni
96.931
+4.597
4.98%
Classificazione dei paesi secondo i statistiche attuali per anni
