29
/it/
it
AIzaSyAYiBZKx7MnpbEhh9jyipgxe19OcubqV5w
April 1, 2024
266982
Trinidad and Tobago
TTO
true
2
1
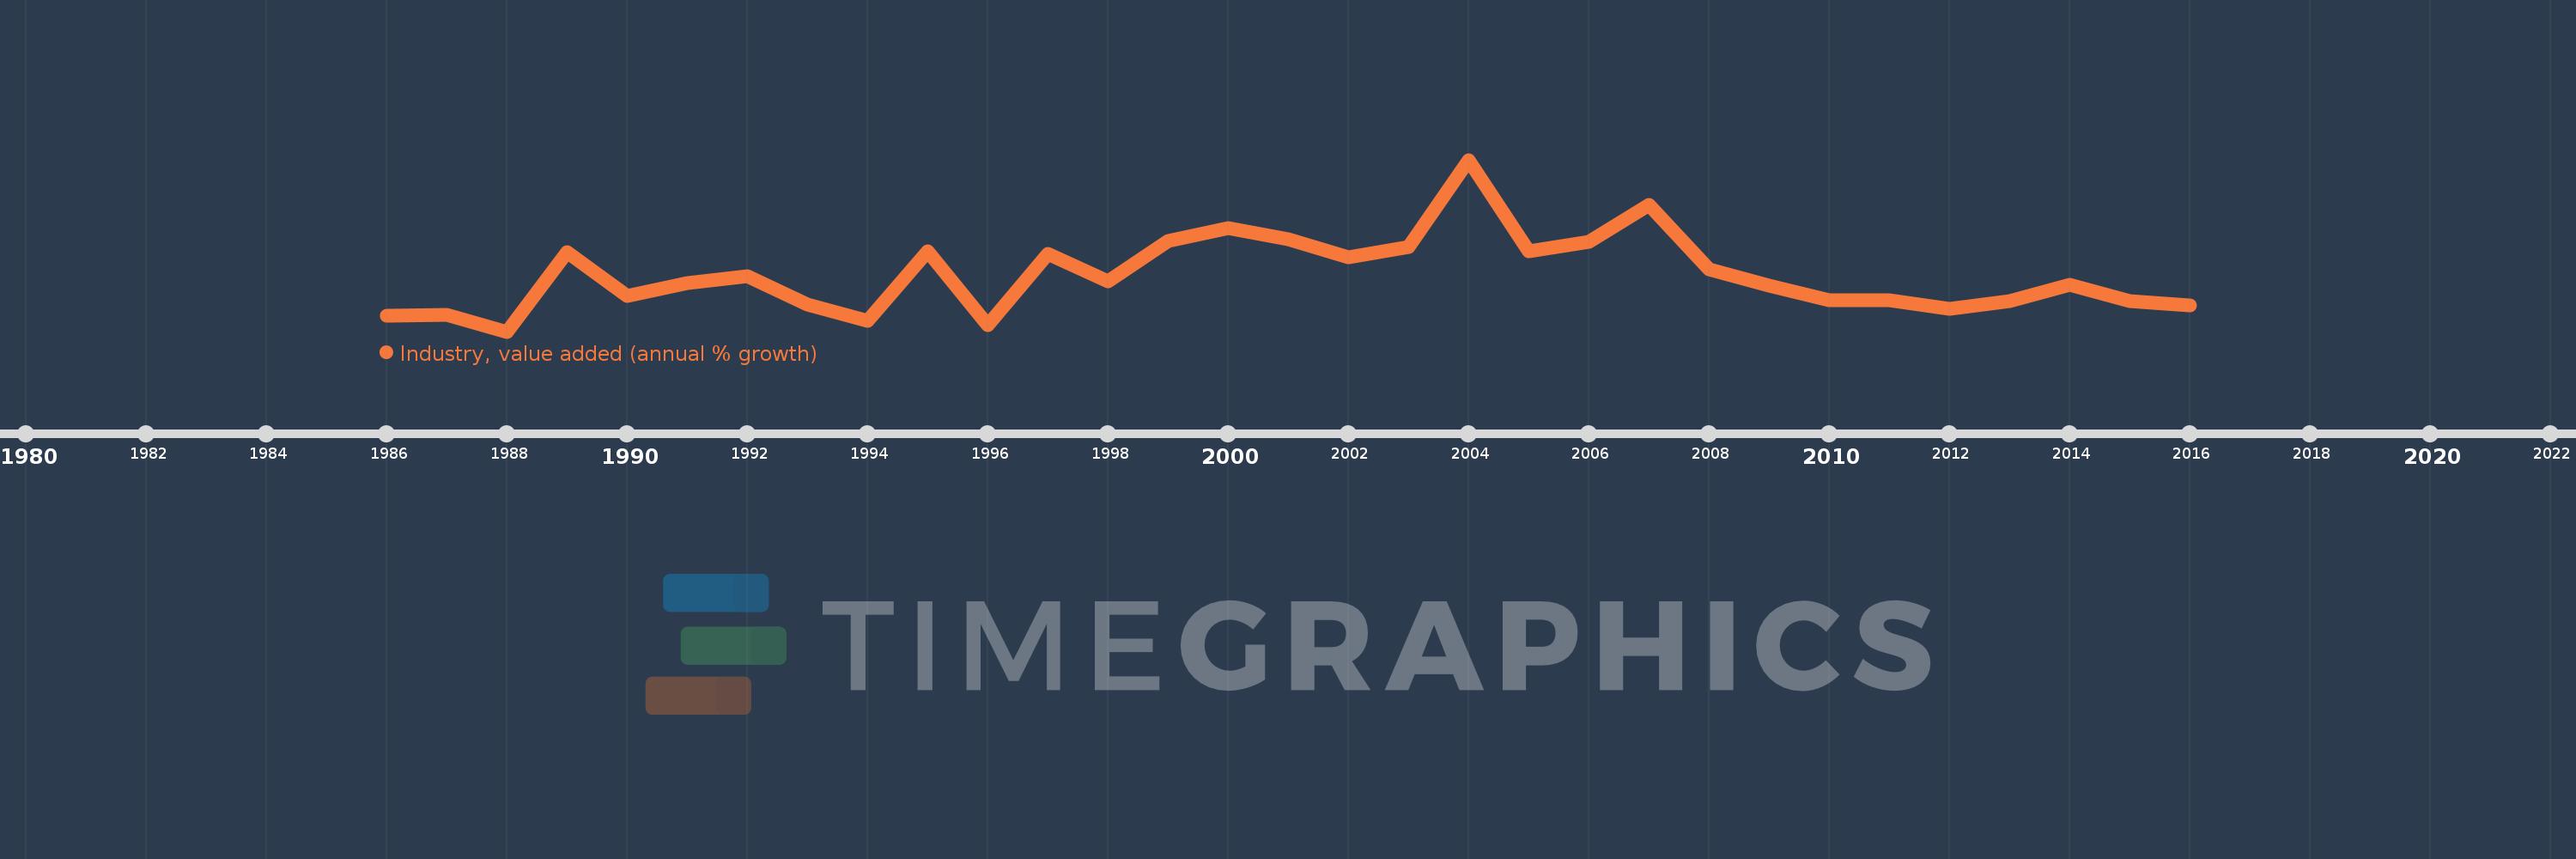
Industry, value added (annual % growth)
2016,2015,2014,2013,2012,2011,2010,2009,2008,2007,2006,2005,2004,2003,2002,2001,2000,1999,1998,1997,1996,1995,1994,1993,1992,1991,1990,1989,1988,1987,1986
Queste statistiche in altri paesi:
AfghanistanAlbaniaAlgeriaAntigua and BarbudaArab WorldArgentinaArmeniaAustraliaAustriaAzerbaijanBahamas, TheBahrainBangladeshBelarusBelgiumBelizeBeninBermudaBhutanBoliviaBosnia and HerzegovinaBotswanaBrazilBrunei DarussalamBulgariaBurkina FasoBurundiCabo VerdeCambodiaCameroonCanadaCaribbean small statesCayman IslandsCentral African RepublicCentral Europe and the BalticsChadChileChinaColombiaComorosCongo, Dem. Rep.Congo, Rep.Costa RicaCote d'IvoireCroatiaCubaCyprusCzech RepublicDenmarkDjiboutiDominicaDominican RepublicEarly-demographic dividendEast Asia & PacificEast Asia & Pacific (excluding high income)East Asia & Pacific (IDA & IBRD countries)EcuadorEgypt, Arab Rep.El SalvadorEquatorial GuineaEritreaEstoniaEthiopiaEuro areaEurope & Central AsiaEurope & Central Asia (excluding high income)Europe & Central Asia (IDA & IBRD countries)European UnionFijiFinlandFragile and conflict affected situationsFranceGabonGambia, TheGeorgiaGermanyGhanaGreeceGrenadaGuatemalaGuineaGuinea-BissauGuyanaHaitiHeavily indebted poor countries (HIPC)High incomeHondurasHong Kong SAR, ChinaHungaryIBRD onlyIcelandIDA & IBRD totalIDA blendIDA onlyIDA totalIndiaIndonesiaIran, Islamic Rep.IraqIrelandItalyJamaicaJapanJordanKazakhstanKenyaKiribatiKorea, Rep.KosovoKuwaitKyrgyz RepublicLao PDRLate-demographic dividendLatin America & Caribbean Latin America & Caribbean (excluding high income)Latin America & the Caribbean (IDA & IBRD countries)LatviaLeast developed countries: UN classificationLebanonLesothoLiberiaLithuaniaLow & middle incomeLow incomeLower middle incomeLuxembourgMacedonia, FYRMadagascarMalawiMalaysiaMaldivesMaliMarshall IslandsMauritaniaMauritiusMexicoMicronesia, Fed. Sts.Middle East & North AfricaMiddle East & North Africa (excluding high income)Middle East & North Africa (IDA & IBRD countries)Middle incomeMoldovaMongoliaMontenegroMoroccoMozambiqueMyanmarNamibiaNepalNetherlandsNew ZealandNicaraguaNigerNigeriaNorth AmericaNorwayOECD membersOmanOther small statesPacific island small statesPakistanPalauPanamaPapua New GuineaParaguayPeruPhilippinesPolandPortugalPost-demographic dividendPre-demographic dividendPuerto RicoQatarRomaniaRussian FederationRwandaSamoaSao Tome and PrincipeSaudi ArabiaSenegalSerbiaSeychellesSierra LeoneSingaporeSlovak RepublicSloveniaSmall statesSolomon IslandsSomaliaSouth AfricaSouth AsiaSouth Asia (IDA & IBRD)SpainSri LankaSt. Kitts and NevisSt. LuciaSt. Vincent and the GrenadinesSub-Saharan Africa Sub-Saharan Africa (excluding high income)Sub-Saharan Africa (IDA & IBRD countries)SudanSurinameSwazilandSwedenSwitzerlandSyrian Arab RepublicTajikistanTanzaniaThailandTimor-LesteTogoTongaTrinidad and TobagoTunisiaTurkeyTurkmenistanTuvaluUgandaUkraineUnited Arab EmiratesUnited KingdomUnited StatesUpper middle incomeUruguayUzbekistanVanuatuVenezuela, RBVietnamWest Bank and GazaWorldZambiaZimbabwe Linea del tempo:
Questa scala temporale mostra un grafico dal 1986 anno al 2016 anno. Trinidad and Tobago. I dati fino ad 1985 anno non disponibili. Il numero di osservazioni attuali secondo i date: 31.
La fonte (nome):
Indicatori dello sviluppo mondiale
La fonte (organizzazione):
World Bank national accounts data, and OECD National Accounts data files.
Categorie:
Economy & Growth
sono stati aggiornati
23 apr 2017 anni
Indicatori delle variazioni dei valori per anni
Minima:
-8.219
1 gen 1988 anni
Massimo:
26.529
1 gen 2004 anni
Alla data di osservazione
Valore
Variazione assoluta
La variazione rispetto al valore precedente
1 gen 1986 anni
-5.071
-5.071
0.0%
1 gen 1987 anni
-4.859
+0.211
-4.17%
1 gen 1988 anni
-8.219
-3.359
69.13%
1 gen 1989 anni
7.804
+16.022
-194.95%
1 gen 1990 anni
-1.016
-8.819
-113.01%
1 gen 1991 anni
1.599
+2.615
-257.49%
1 gen 1992 anni
2.916
+1.316
82.31%
1 gen 1993 anni
-2.772
-5.688
-195.07%
1 gen 1994 anni
-5.992
-3.22
116.16%
1 gen 1995 anni
8.059
+14.051
-234.49%
1 gen 1996 anni
-6.876
-14.935
-185.32%
1 gen 1997 anni
7.425
+14.301
-207.98%
1 gen 1998 anni
1.868
-5.556
-74.84%
1 gen 1999 anni
10.183
+8.315
445.11%
1 gen 2000 anni
12.634
+2.451
24.07%
1 gen 2001 anni
10.413
-2.221
-17.58%
1 gen 2002 anni
6.886
-3.527
-33.87%
1 gen 2003 anni
8.836
+1.95
28.32%
1 gen 2004 anni
26.529
+17.693
200.24%
1 gen 2005 anni
8.046
-18.483
-69.67%
1 gen 2006 anni
9.966
+1.92
23.87%
1 gen 2007 anni
17.438
+7.472
74.97%
1 gen 2008 anni
4.351
-13.087
-75.05%
1 gen 2009 anni
1.042
-3.309
-76.05%
1 gen 2010 anni
-1.952
-2.994
-287.36%
1 gen 2011 anni
-1.873
+0.079
-4.07%
1 gen 2012 anni
-3.54
-1.667
89.02%
1 gen 2013 anni
-2.012
+1.528
-43.15%
1 gen 2014 anni
1.225
+3.238
-160.9%
1 gen 2015 anni
-2.089
-3.314
-270.44%
1 gen 2016 anni
-2.997
-0.908
43.48%
Classificazione dei paesi secondo i statistiche attuali per anni


Commenti: