29
/it/
it
AIzaSyAYiBZKx7MnpbEhh9jyipgxe19OcubqV5w
April 1, 2024
134247
France
FRA
true
2
1
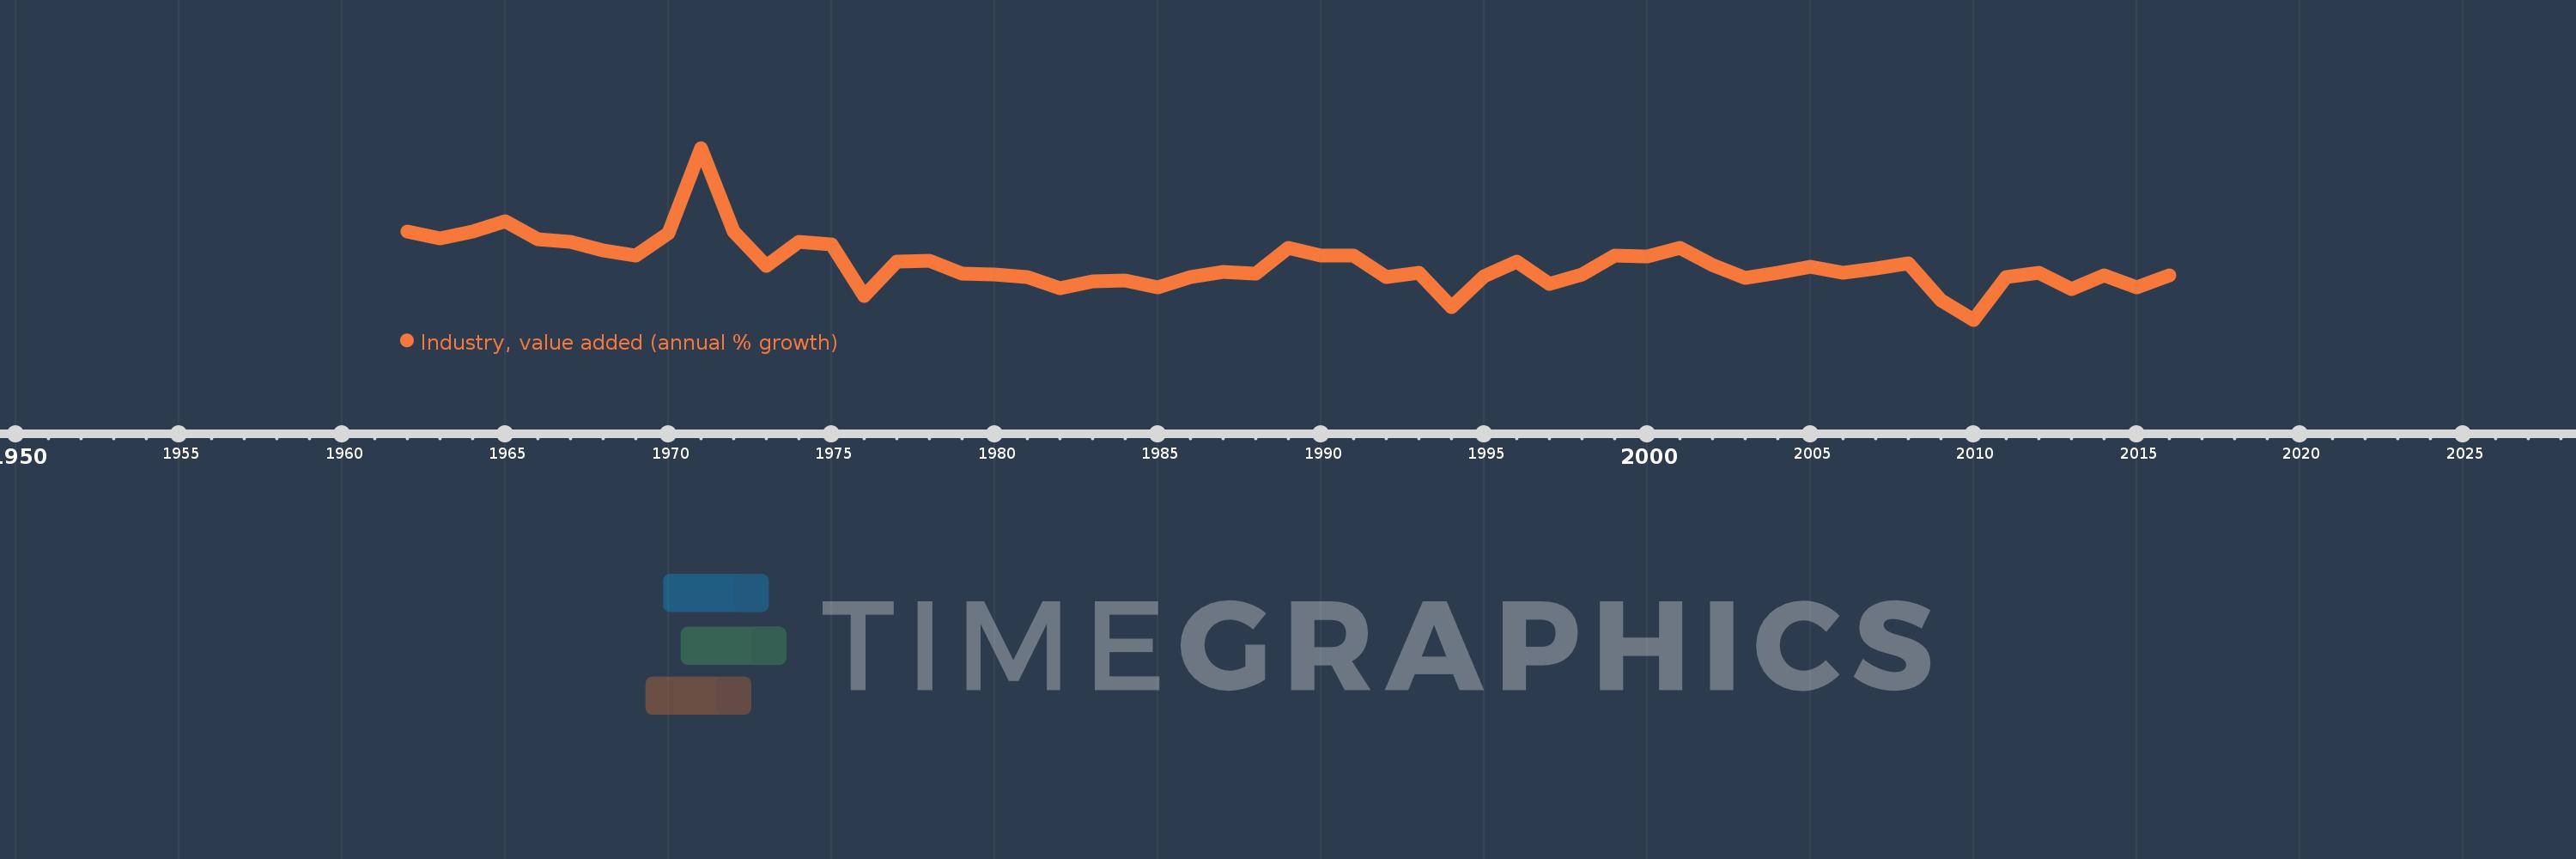
Industry, value added (annual % growth)
2016,2015,2014,2013,2012,2011,2010,2009,2008,2007,2006,2005,2004,2003,2002,2001,2000,1999,1998,1997,1996,1995,1994,1993,1992,1991,1990,1989,1988,1987,1986,1985,1984,1983,1982,1981,1980,1979,1978,1977,1976,1975,1974,1973,1972,1971,1970,1969,1968,1967,1966,1965,1964,1963,1962
Queste statistiche in altri paesi:
AfghanistanAlbaniaAlgeriaAntigua and BarbudaArab WorldArgentinaArmeniaAustraliaAustriaAzerbaijanBahamas, TheBahrainBangladeshBelarusBelgiumBelizeBeninBermudaBhutanBoliviaBosnia and HerzegovinaBotswanaBrazilBrunei DarussalamBulgariaBurkina FasoBurundiCabo VerdeCambodiaCameroonCanadaCaribbean small statesCayman IslandsCentral African RepublicCentral Europe and the BalticsChadChileChinaColombiaComorosCongo, Dem. Rep.Congo, Rep.Costa RicaCote d'IvoireCroatiaCubaCyprusCzech RepublicDenmarkDjiboutiDominicaDominican RepublicEarly-demographic dividendEast Asia & PacificEast Asia & Pacific (excluding high income)East Asia & Pacific (IDA & IBRD countries)EcuadorEgypt, Arab Rep.El SalvadorEquatorial GuineaEritreaEstoniaEthiopiaEuro areaEurope & Central AsiaEurope & Central Asia (excluding high income)Europe & Central Asia (IDA & IBRD countries)European UnionFijiFinlandFragile and conflict affected situationsFranceGabonGambia, TheGeorgiaGermanyGhanaGreeceGrenadaGuatemalaGuineaGuinea-BissauGuyanaHaitiHeavily indebted poor countries (HIPC)High incomeHondurasHong Kong SAR, ChinaHungaryIBRD onlyIcelandIDA & IBRD totalIDA blendIDA onlyIDA totalIndiaIndonesiaIran, Islamic Rep.IraqIrelandItalyJamaicaJapanJordanKazakhstanKenyaKiribatiKorea, Rep.KosovoKuwaitKyrgyz RepublicLao PDRLate-demographic dividendLatin America & Caribbean Latin America & Caribbean (excluding high income)Latin America & the Caribbean (IDA & IBRD countries)LatviaLeast developed countries: UN classificationLebanonLesothoLiberiaLithuaniaLow & middle incomeLow incomeLower middle incomeLuxembourgMacedonia, FYRMadagascarMalawiMalaysiaMaldivesMaliMarshall IslandsMauritaniaMauritiusMexicoMicronesia, Fed. Sts.Middle East & North AfricaMiddle East & North Africa (excluding high income)Middle East & North Africa (IDA & IBRD countries)Middle incomeMoldovaMongoliaMontenegroMoroccoMozambiqueMyanmarNamibiaNepalNetherlandsNew ZealandNicaraguaNigerNigeriaNorth AmericaNorwayOECD membersOmanOther small statesPacific island small statesPakistanPalauPanamaPapua New GuineaParaguayPeruPhilippinesPolandPortugalPost-demographic dividendPre-demographic dividendPuerto RicoQatarRomaniaRussian FederationRwandaSamoaSao Tome and PrincipeSaudi ArabiaSenegalSerbiaSeychellesSierra LeoneSingaporeSlovak RepublicSloveniaSmall statesSolomon IslandsSomaliaSouth AfricaSouth AsiaSouth Asia (IDA & IBRD)SpainSri LankaSt. Kitts and NevisSt. LuciaSt. Vincent and the GrenadinesSub-Saharan Africa Sub-Saharan Africa (excluding high income)Sub-Saharan Africa (IDA & IBRD countries)SudanSurinameSwazilandSwedenSwitzerlandSyrian Arab RepublicTajikistanTanzaniaThailandTimor-LesteTogoTongaTrinidad and TobagoTunisiaTurkeyTurkmenistanTuvaluUgandaUkraineUnited Arab EmiratesUnited KingdomUnited StatesUpper middle incomeUruguayUzbekistanVanuatuVenezuela, RBVietnamWest Bank and GazaWorldZambiaZimbabwe Linea del tempo:
Questa scala temporale mostra un grafico dal 1962 anno al 2016 anno. France. I dati fino ad 1961 anno non disponibili. Il numero di osservazioni attuali secondo i date: 55.
La fonte (nome):
Indicatori dello sviluppo mondiale
La fonte (organizzazione):
World Bank national accounts data, and OECD National Accounts data files.
Categorie:
Economy & Growth
sono stati aggiornati
23 apr 2017 anni
Indicatori delle variazioni dei valori per anni
Minima:
-6.028
1 gen 2010 anni
Massimo:
20.739
1 gen 1971 anni
Alla data di osservazione
Valore
Variazione assoluta
La variazione rispetto al valore precedente
1 gen 1962 anni
7.686
+7.686
0.0%
1 gen 1963 anni
6.637
-1.049
-13.64%
1 gen 1964 anni
7.768
+1.131
17.05%
1 gen 1965 anni
9.366
+1.598
20.57%
1 gen 1966 anni
6.547
-2.819
-30.1%
1 gen 1967 anni
6.122
-0.425
-6.49%
1 gen 1968 anni
4.823
-1.299
-21.22%
1 gen 1969 anni
3.912
-0.91
-18.88%
1 gen 1970 anni
7.425
+3.513
89.78%
1 gen 1971 anni
20.739
+13.314
179.31%
1 gen 1972 anni
7.688
-13.051
-62.93%
1 gen 1973 anni
2.408
-5.28
-68.68%
1 gen 1974 anni
6.172
+3.764
156.33%
1 gen 1975 anni
5.752
-0.421
-6.81%
1 gen 1976 anni
-2.358
-8.11
-140.99%
1 gen 1977 anni
3.027
+5.385
-228.37%
1 gen 1978 anni
3.154
+0.127
4.2%
1 gen 1979 anni
1.192
-1.962
-62.21%
1 gen 1980 anni
1.006
-0.186
-15.61%
1 gen 1981 anni
0.585
-0.421
-41.83%
1 gen 1982 anni
-1.1
-1.685
-288.01%
1 gen 1983 anni
-0.105
+0.995
-90.44%
1 gen 1984 anni
0.075
+0.18
-171.13%
1 gen 1985 anni
-0.995
-1.07
-1.43 Mille.%
1 gen 1986 anni
0.617
+1.612
-162.01%
1 gen 1987 anni
1.382
+0.765
123.94%
1 gen 1988 anni
1.202
-0.18
-13.02%
1 gen 1989 anni
5.24
+4.038
336.02%
1 gen 1990 anni
4.019
-1.221
-23.31%
1 gen 1991 anni
4.007
-0.012
-0.3%
1 gen 1992 anni
0.658
-3.348
-83.57%
1 gen 1993 anni
1.327
+0.668
101.57%
1 gen 1994 anni
-4.112
-5.438
-409.97%
1 gen 1995 anni
0.754
+4.866
-118.34%
1 gen 1996 anni
2.972
+2.218
294.22%
1 gen 1997 anni
-0.386
-3.358
-112.97%
1 gen 1998 anni
0.976
+1.362
-353.1%
1 gen 1999 anni
3.938
+2.962
303.5%
1 gen 2000 anni
3.798
-0.14
-3.55%
1 gen 2001 anni
5.152
+1.354
35.64%
1 gen 2002 anni
2.468
-2.684
-52.09%
1 gen 2003 anni
0.444
-2.024
-82.01%
1 gen 2004 anni
1.249
+0.805
181.27%
1 gen 2005 anni
2.267
+1.018
81.5%
1 gen 2006 anni
1.313
-0.954
-42.1%
1 gen 2007 anni
1.92
+0.607
46.24%
1 gen 2008 anni
2.717
+0.797
41.53%
1 gen 2009 anni
-2.978
-5.695
-209.59%
1 gen 2010 anni
-6.028
-3.05
102.43%
1 gen 2011 anni
0.576
+6.604
-109.55%
1 gen 2012 anni
1.281
+0.705
122.52%
1 gen 2013 anni
-1.185
-2.466
-192.47%
1 gen 2014 anni
0.836
+2.021
-170.55%
1 gen 2015 anni
-0.931
-1.767
-211.4%
1 gen 2016 anni
0.918
+1.849
-198.6%
Classificazione dei paesi secondo i statistiche attuali per anni


Commenti: