29
/it/
it
AIzaSyAYiBZKx7MnpbEhh9jyipgxe19OcubqV5w
April 1, 2024
262533
Thailand
THA
true
2
1
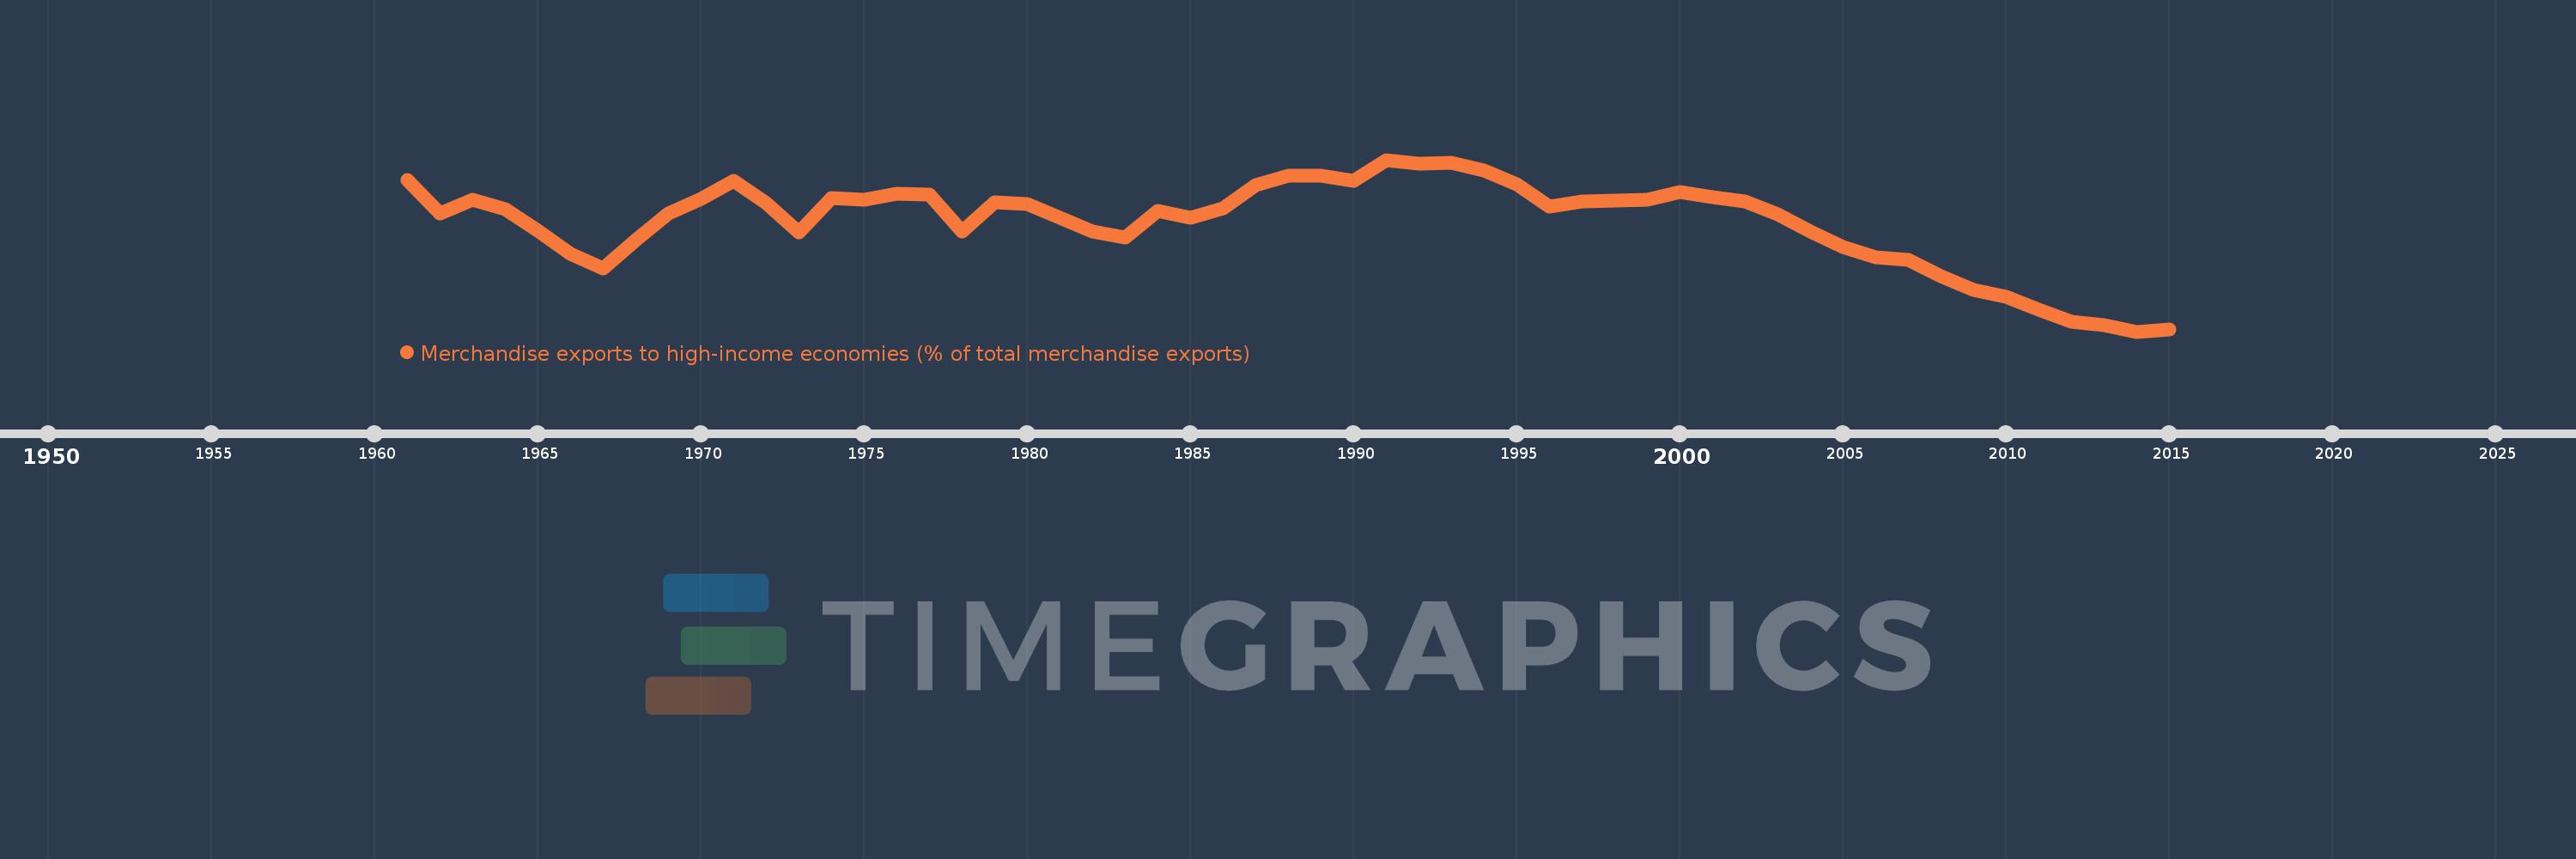
Merchandise exports to high-income economies (% of total merchandise exports)
2015,2014,2013,2012,2011,2010,2009,2008,2007,2006,2005,2004,2003,2002,2001,2000,1999,1998,1997,1996,1995,1994,1993,1992,1991,1990,1989,1988,1987,1986,1985,1984,1983,1982,1981,1980,1979,1978,1977,1976,1975,1974,1973,1972,1971,1970,1969,1968,1967,1966,1965,1964,1963,1962,1961
Queste statistiche in altri paesi:
AfghanistanAlbaniaAlgeriaAmerican SamoaAngolaAntigua and BarbudaArab WorldArgentinaArmeniaArubaAustraliaAustriaAzerbaijanBahamas, TheBahrainBangladeshBarbadosBelarusBelgiumBelizeBeninBermudaBoliviaBosnia and HerzegovinaBrazilBrunei DarussalamBulgariaBurkina FasoBurundiCabo VerdeCambodiaCameroonCanadaCaribbean small statesCentral African RepublicCentral Europe and the BalticsChadChileChinaColombiaComorosCongo, Dem. Rep.Congo, Rep.Costa RicaCote d'IvoireCroatiaCubaCyprusCzech RepublicDenmarkDjiboutiDominicaDominican RepublicEarly-demographic dividendEast Asia & PacificEast Asia & Pacific (excluding high income)East Asia & Pacific (IDA & IBRD countries)EcuadorEgypt, Arab Rep.El SalvadorEquatorial GuineaEstoniaEthiopiaEuro areaEurope & Central AsiaEurope & Central Asia (excluding high income)Europe & Central Asia (IDA & IBRD countries)European UnionFaroe IslandsFijiFinlandFragile and conflict affected situationsFranceFrench PolynesiaGabonGambia, TheGeorgiaGermanyGhanaGibraltarGreeceGreenlandGrenadaGuamGuatemalaGuineaGuinea-BissauGuyanaHaitiHeavily indebted poor countries (HIPC)High incomeHondurasHong Kong SAR, ChinaHungaryIBRD onlyIcelandIDA & IBRD totalIDA blendIDA onlyIDA totalIndiaIndonesiaIran, Islamic Rep.IraqIrelandIsraelItalyJamaicaJapanJordanKazakhstanKenyaKiribatiKorea, Dem. People’s Rep.Korea, Rep.KosovoKuwaitKyrgyz RepublicLao PDRLate-demographic dividendLatin America & Caribbean Latin America & Caribbean (excluding high income)Latin America & the Caribbean (IDA & IBRD countries)LatviaLeast developed countries: UN classificationLebanonLiberiaLibyaLithuaniaLow & middle incomeLow incomeLower middle incomeLuxembourgMacao SAR, ChinaMacedonia, FYRMadagascarMalawiMalaysiaMaldivesMaliMaltaMauritaniaMauritiusMexicoMiddle East & North AfricaMiddle East & North Africa (excluding high income)Middle East & North Africa (IDA & IBRD countries)Middle incomeMoldovaMongoliaMontenegroMoroccoMozambiqueMyanmarNauruNepalNetherlandsNew CaledoniaNew ZealandNicaraguaNigerNigeriaNorth AmericaNorwayOECD membersOmanOther small statesPacific island small statesPakistanPanamaPapua New GuineaParaguayPeruPhilippinesPolandPortugalPost-demographic dividendPre-demographic dividendQatarRomaniaRussian FederationRwandaSamoaSao Tome and PrincipeSaudi ArabiaSenegalSerbiaSeychellesSierra LeoneSingaporeSlovak RepublicSloveniaSmall statesSolomon IslandsSomaliaSouth AfricaSouth AsiaSouth Asia (IDA & IBRD)SpainSri LankaSt. Kitts and NevisSt. LuciaSt. Vincent and the GrenadinesSub-Saharan Africa Sub-Saharan Africa (excluding high income)Sub-Saharan Africa (IDA & IBRD countries)SudanSurinameSwedenSwitzerlandSyrian Arab RepublicTajikistanTanzaniaThailandTogoTongaTrinidad and TobagoTunisiaTurkeyTurkmenistanTuvaluUgandaUkraineUnited Arab EmiratesUnited KingdomUnited StatesUpper middle incomeUruguayUzbekistanVanuatuVenezuela, RBVietnamWorldYemen, Rep.ZambiaZimbabwe Linea del tempo:
Questa scala temporale mostra un grafico dal 1961 anno al 2015 anno. Thailand. I dati fino ad 1960 anno non disponibili. Il numero di osservazioni attuali secondo i date: 55.
La fonte (nome):
Indicatori dello sviluppo mondiale
La fonte (organizzazione):
World Bank staff estimates based data from International Monetary Fund's Direction of Trade database.
Categorie:
Private Sector, Trade
sono stati aggiornati
23 apr 2017 anni
Indicatori delle variazioni dei valori per anni
Minima:
55.336
1 gen 2014 anni
Massimo:
85.178
1 gen 1991 anni
Alla data di osservazione
Valore
Variazione assoluta
La variazione rispetto al valore precedente
1 gen 1961 anni
81.61
+81.61
0.0%
1 gen 1962 anni
75.827
-5.783
-7.09%
1 gen 1963 anni
78.223
+2.397
3.16%
1 gen 1964 anni
76.534
-1.689
-2.16%
1 gen 1965 anni
72.823
-3.712
-4.85%
1 gen 1966 anni
68.853
-3.969
-5.45%
1 gen 1967 anni
66.246
-2.607
-3.79%
1 gen 1968 anni
71.23
+4.984
7.52%
1 gen 1969 anni
75.783
+4.553
6.39%
1 gen 1970 anni
78.368
+2.585
3.41%
1 gen 1971 anni
81.535
+3.167
4.04%
1 gen 1972 anni
77.579
-3.956
-4.85%
1 gen 1973 anni
72.563
-5.017
-6.47%
1 gen 1974 anni
78.511
+5.948
8.2%
1 gen 1975 anni
78.221
-0.29
-0.37%
1 gen 1976 anni
79.286
+1.066
1.36%
1 gen 1977 anni
79.137
-0.15
-0.19%
1 gen 1978 anni
72.774
-6.363
-8.04%
1 gen 1979 anni
77.852
+5.078
6.98%
1 gen 1980 anni
77.457
-0.395
-0.51%
1 gen 1981 anni
75.056
-2.401
-3.1%
1 gen 1982 anni
72.7
-2.355
-3.14%
1 gen 1983 anni
71.644
-1.056
-1.45%
1 gen 1984 anni
76.259
+4.615
6.44%
1 gen 1985 anni
75.073
-1.186
-1.55%
1 gen 1986 anni
76.765
+1.692
2.25%
1 gen 1987 anni
80.782
+4.017
5.23%
1 gen 1988 anni
82.444
+1.661
2.06%
1 gen 1989 anni
82.404
-0.04
-0.05%
1 gen 1990 anni
81.458
-0.945
-1.15%
1 gen 1991 anni
85.178
+3.72
4.57%
1 gen 1992 anni
84.528
-0.65
-0.76%
1 gen 1993 anni
84.716
+0.188
0.22%
1 gen 1994 anni
83.387
-1.329
-1.57%
1 gen 1995 anni
80.987
-2.4
-2.88%
1 gen 1996 anni
77.031
-3.956
-4.88%
1 gen 1997 anni
77.892
+0.861
1.12%
1 gen 1998 anni
78.063
+0.171
0.22%
1 gen 1999 anni
78.271
+0.208
0.27%
1 gen 2000 anni
79.654
+1.384
1.77%
1 gen 2001 anni
78.717
-0.938
-1.18%
1 gen 2002 anni
77.958
-0.758
-0.96%
1 gen 2003 anni
75.689
-2.269
-2.91%
1 gen 2004 anni
72.787
-2.902
-3.83%
1 gen 2005 anni
70.025
-2.762
-3.79%
1 gen 2006 anni
68.242
-1.783
-2.55%
1 gen 2007 anni
67.741
-0.501
-0.73%
1 gen 2008 anni
65.026
-2.715
-4.01%
1 gen 2009 anni
62.636
-2.39
-3.68%
1 gen 2010 anni
61.329
-1.307
-2.09%
1 gen 2011 anni
59.18
-2.149
-3.5%
1 gen 2012 anni
57.055
-2.125
-3.59%
1 gen 2013 anni
56.487
-0.568
-0.99%
1 gen 2014 anni
55.336
-1.152
-2.04%
1 gen 2015 anni
55.662
+0.326
0.59%
Classificazione dei paesi secondo i statistiche attuali per anni


Commenti: