29
/it/
it
AIzaSyAYiBZKx7MnpbEhh9jyipgxe19OcubqV5w
April 1, 2024
102677
Central African Republic
CAF
true
2
1
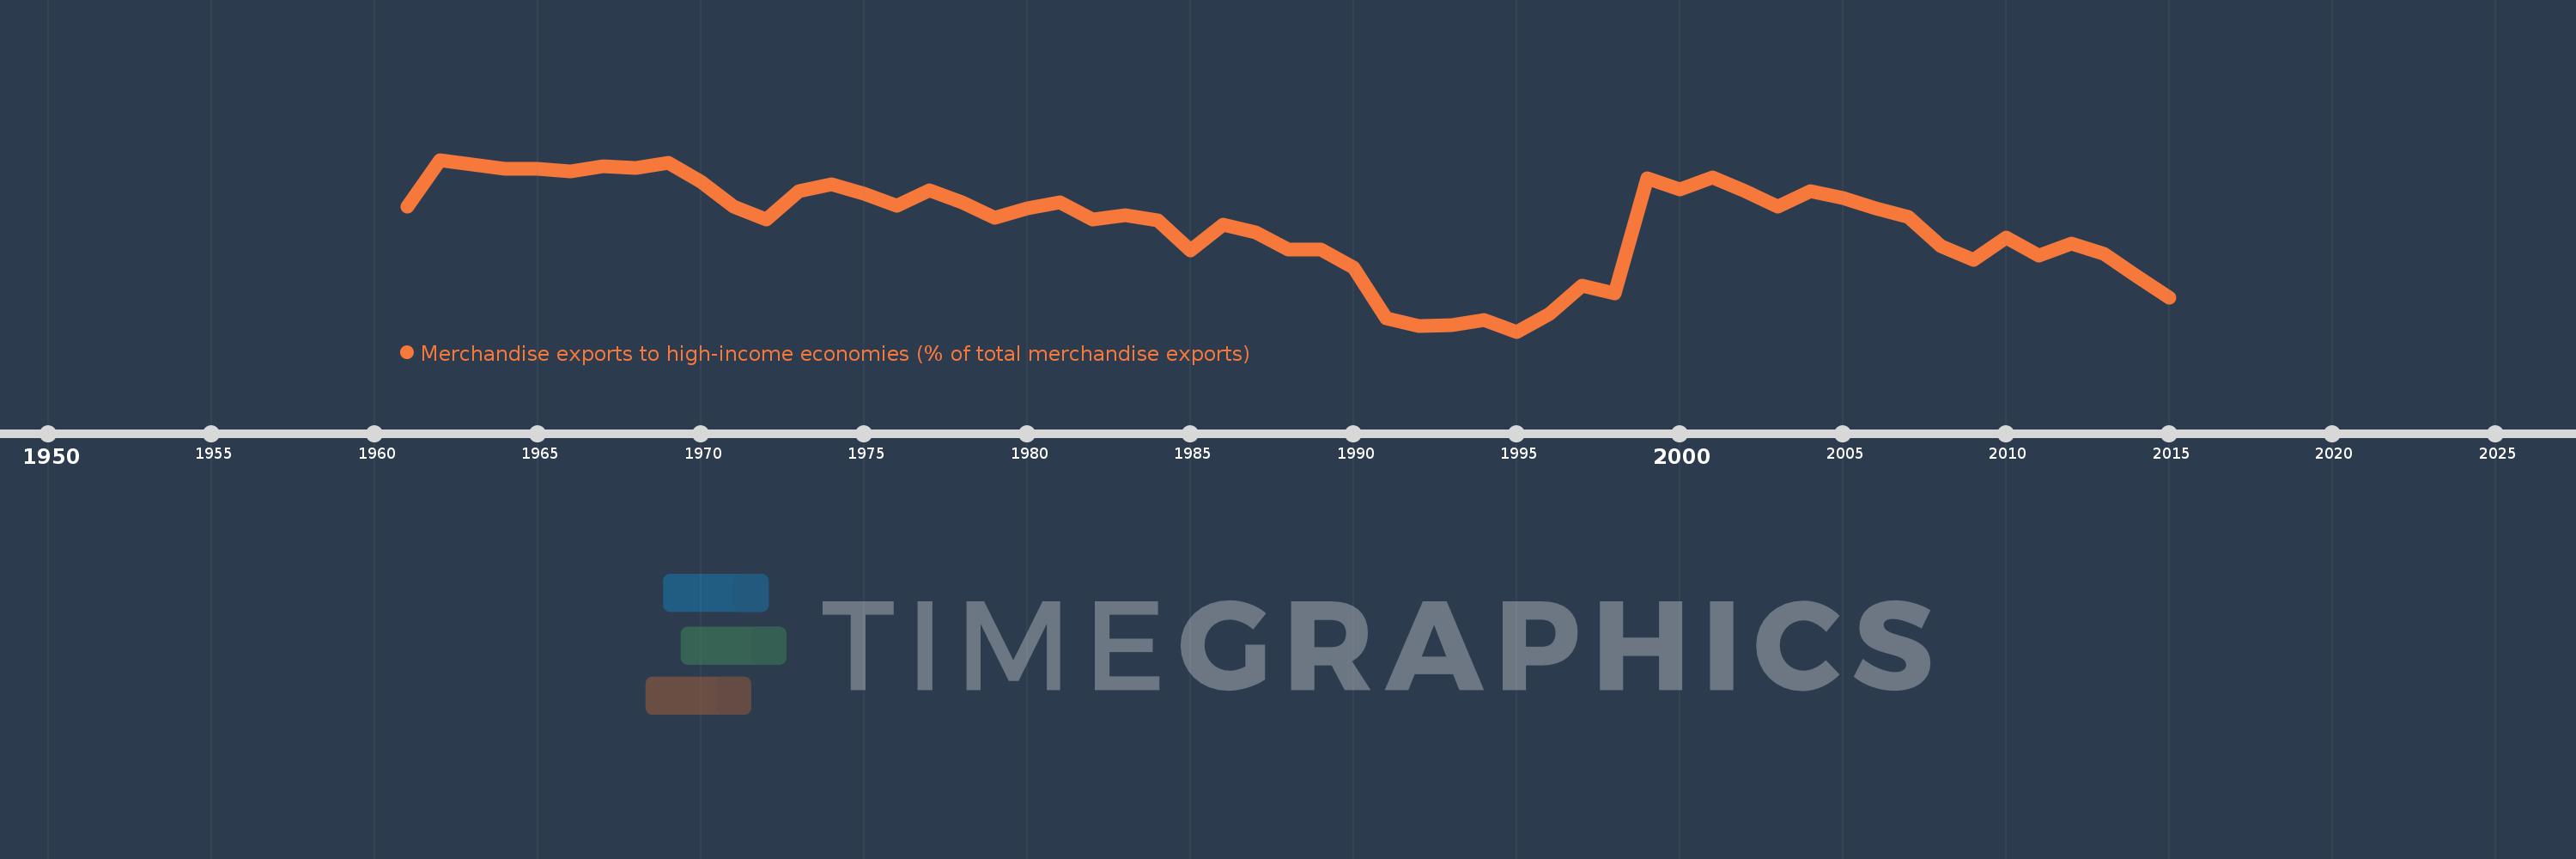
Merchandise exports to high-income economies (% of total merchandise exports)
2015,2014,2013,2012,2011,2010,2009,2008,2007,2006,2005,2004,2003,2002,2001,2000,1999,1998,1997,1996,1995,1994,1993,1992,1991,1990,1989,1988,1987,1986,1985,1984,1983,1982,1981,1980,1979,1978,1977,1976,1975,1974,1973,1972,1971,1970,1969,1968,1967,1966,1965,1964,1962,1961
Queste statistiche in altri paesi:
AfghanistanAlbaniaAlgeriaAmerican SamoaAngolaAntigua and BarbudaArab WorldArgentinaArmeniaArubaAustraliaAustriaAzerbaijanBahamas, TheBahrainBangladeshBarbadosBelarusBelgiumBelizeBeninBermudaBoliviaBosnia and HerzegovinaBrazilBrunei DarussalamBulgariaBurkina FasoBurundiCabo VerdeCambodiaCameroonCanadaCaribbean small statesCentral African RepublicCentral Europe and the BalticsChadChileChinaColombiaComorosCongo, Dem. Rep.Congo, Rep.Costa RicaCote d'IvoireCroatiaCubaCyprusCzech RepublicDenmarkDjiboutiDominicaDominican RepublicEarly-demographic dividendEast Asia & PacificEast Asia & Pacific (excluding high income)East Asia & Pacific (IDA & IBRD countries)EcuadorEgypt, Arab Rep.El SalvadorEquatorial GuineaEstoniaEthiopiaEuro areaEurope & Central AsiaEurope & Central Asia (excluding high income)Europe & Central Asia (IDA & IBRD countries)European UnionFaroe IslandsFijiFinlandFragile and conflict affected situationsFranceFrench PolynesiaGabonGambia, TheGeorgiaGermanyGhanaGibraltarGreeceGreenlandGrenadaGuamGuatemalaGuineaGuinea-BissauGuyanaHaitiHeavily indebted poor countries (HIPC)High incomeHondurasHong Kong SAR, ChinaHungaryIBRD onlyIcelandIDA & IBRD totalIDA blendIDA onlyIDA totalIndiaIndonesiaIran, Islamic Rep.IraqIrelandIsraelItalyJamaicaJapanJordanKazakhstanKenyaKiribatiKorea, Dem. People’s Rep.Korea, Rep.KosovoKuwaitKyrgyz RepublicLao PDRLate-demographic dividendLatin America & Caribbean Latin America & Caribbean (excluding high income)Latin America & the Caribbean (IDA & IBRD countries)LatviaLeast developed countries: UN classificationLebanonLiberiaLibyaLithuaniaLow & middle incomeLow incomeLower middle incomeLuxembourgMacao SAR, ChinaMacedonia, FYRMadagascarMalawiMalaysiaMaldivesMaliMaltaMauritaniaMauritiusMexicoMiddle East & North AfricaMiddle East & North Africa (excluding high income)Middle East & North Africa (IDA & IBRD countries)Middle incomeMoldovaMongoliaMontenegroMoroccoMozambiqueMyanmarNauruNepalNetherlandsNew CaledoniaNew ZealandNicaraguaNigerNigeriaNorth AmericaNorwayOECD membersOmanOther small statesPacific island small statesPakistanPanamaPapua New GuineaParaguayPeruPhilippinesPolandPortugalPost-demographic dividendPre-demographic dividendQatarRomaniaRussian FederationRwandaSamoaSao Tome and PrincipeSaudi ArabiaSenegalSerbiaSeychellesSierra LeoneSingaporeSlovak RepublicSloveniaSmall statesSolomon IslandsSomaliaSouth AfricaSouth AsiaSouth Asia (IDA & IBRD)SpainSri LankaSt. Kitts and NevisSt. LuciaSt. Vincent and the GrenadinesSub-Saharan Africa Sub-Saharan Africa (excluding high income)Sub-Saharan Africa (IDA & IBRD countries)SudanSurinameSwedenSwitzerlandSyrian Arab RepublicTajikistanTanzaniaThailandTogoTongaTrinidad and TobagoTunisiaTurkeyTurkmenistanTuvaluUgandaUkraineUnited Arab EmiratesUnited KingdomUnited StatesUpper middle incomeUruguayUzbekistanVanuatuVenezuela, RBVietnamWorldYemen, Rep.ZambiaZimbabwe Linea del tempo:
Questa scala temporale mostra un grafico dal 1961 anno al 2015 anno. Central African Republic. I dati fino ad 1960 anno non disponibili. Il numero di osservazioni attuali secondo i date: 54.
La fonte (nome):
Indicatori dello sviluppo mondiale
La fonte (organizzazione):
World Bank staff estimates based data from International Monetary Fund's Direction of Trade database.
Categorie:
Private Sector, Trade
sono stati aggiornati
23 apr 2017 anni
Indicatori delle variazioni dei valori per anni
Minima:
8.394
1 gen 1995 anni
Massimo:
100.0
1 gen 1962 anni
Alla data di osservazione
Valore
Variazione assoluta
La variazione rispetto al valore precedente
1 gen 1961 anni
74.82
+74.82
0.0%
1 gen 1962 anni
100.0
+25.18
33.65%
1 gen 1964 anni
95.0
-5.0
-5.0%
1 gen 1965 anni
95.156
+0.156
0.16%
1 gen 1966 anni
93.87
-1.286
-1.35%
1 gen 1967 anni
96.764
+2.894
3.08%
1 gen 1968 anni
95.502
-1.262
-1.3%
1 gen 1969 anni
98.58
+3.078
3.22%
1 gen 1970 anni
88.482
-10.098
-10.24%
1 gen 1971 anni
75.248
-13.234
-14.96%
1 gen 1972 anni
68.046
-7.201
-9.57%
1 gen 1973 anni
83.322
+15.276
22.45%
1 gen 1974 anni
87.023
+3.701
4.44%
1 gen 1975 anni
81.948
-5.075
-5.83%
1 gen 1976 anni
75.45
-6.498
-7.93%
1 gen 1977 anni
83.606
+8.156
10.81%
1 gen 1978 anni
77.415
-6.191
-7.41%
1 gen 1979 anni
69.128
-8.287
-10.7%
1 gen 1980 anni
74.185
+5.056
7.31%
1 gen 1981 anni
77.541
+3.356
4.52%
1 gen 1982 anni
68.186
-9.355
-12.06%
1 gen 1983 anni
70.586
+2.4
3.52%
1 gen 1984 anni
67.871
-2.715
-3.85%
1 gen 1985 anni
51.681
-16.191
-23.85%
1 gen 1986 anni
65.576
+13.895
26.89%
1 gen 1987 anni
61.145
-4.431
-6.76%
1 gen 1988 anni
52.246
-8.899
-14.55%
1 gen 1989 anni
52.043
-0.204
-0.39%
1 gen 1990 anni
42.611
-9.431
-18.12%
1 gen 1991 anni
15.496
-27.115
-63.63%
1 gen 1992 anni
11.338
-4.158
-26.83%
1 gen 1993 anni
11.622
+0.284
2.51%
1 gen 1994 anni
14.492
+2.87
24.7%
1 gen 1995 anni
8.394
-6.099
-42.08%
1 gen 1996 anni
17.997
+9.604
114.41%
1 gen 1997 anni
33.079
+15.081
83.8%
1 gen 1998 anni
28.793
-4.285
-12.95%
1 gen 1999 anni
90.028
+61.234
212.67%
1 gen 2000 anni
83.982
-6.046
-6.72%
1 gen 2001 anni
90.731
+6.749
8.04%
1 gen 2002 anni
83.368
-7.363
-8.12%
1 gen 2003 anni
74.919
-8.449
-10.13%
1 gen 2004 anni
83.109
+8.19
10.93%
1 gen 2005 anni
79.538
-3.57
-4.3%
1 gen 2006 anni
74.258
-5.28
-6.64%
1 gen 2007 anni
69.472
-4.786
-6.45%
1 gen 2008 anni
53.992
-15.48
-22.28%
1 gen 2009 anni
46.82
-7.172
-13.28%
1 gen 2010 anni
58.571
+11.751
25.1%
1 gen 2011 anni
48.939
-9.631
-16.44%
1 gen 2012 anni
55.39
+6.451
13.18%
1 gen 2013 anni
49.803
-5.588
-10.09%
1 gen 2014 anni
38.085
-11.717
-23.53%
1 gen 2015 anni
26.707
-11.378
-29.88%
Classificazione dei paesi secondo i statistiche attuali per anni


Commenti: