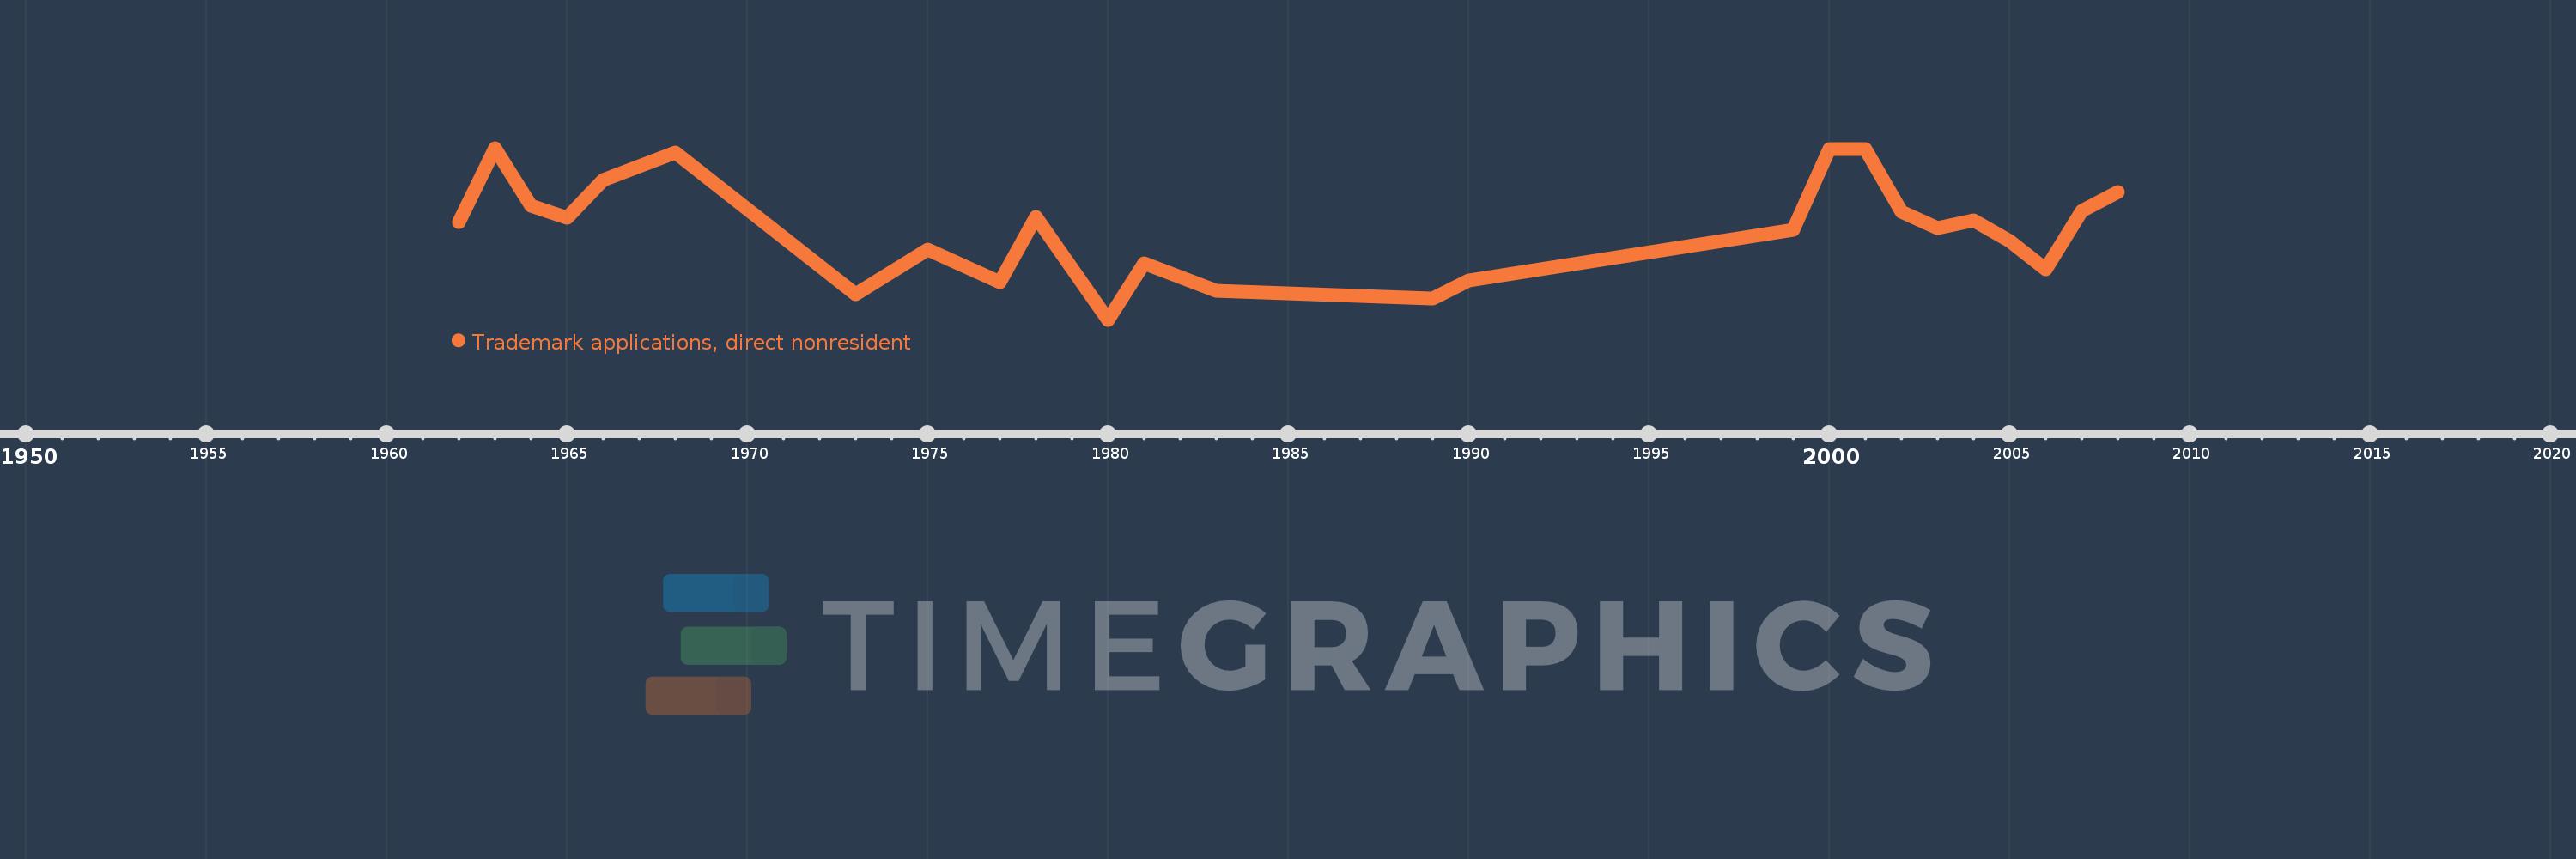
Questa scala temporale mostra un grafico dal 1962 anno al 2008 anno. Tanzania. I dati fino ad 1961 anno non disponibili. Il numero di osservazioni attuali secondo i date: 25.
La fonte (nome):
Indicatori dello sviluppo mondiale
La fonte (organizzazione):
World Intellectual Property Organization (WIPO), WIPO Patent Report: Statistics on Worldwide Patent Activity. The International Bureau of WIPO assumes no responsibility with respect to the transformation of these data.
Categorie:
Science & Technology
sono stati aggiornati
23 apr 2017 anni
Indicatori delle variazioni dei valori per anni
In media:
413.6
Minima:
178.0
1 gen 1980 anni
Massimo:
624.0
1 gen 1963 anni
Alla data di osservazione
Valore
Variazione assoluta
La variazione rispetto al valore precedente
1 gen 1962 anni
431.0
+431.0
0.0%
1 gen 1963 anni
624.0
+193.0
44.78%
1 gen 1964 anni
474.0
-150.0
-24.04%
1 gen 1965 anni
443.0
-31.0
-6.54%
1 gen 1966 anni
540.0
+97.0
21.9%
1 gen 1968 anni
612.0
+72.0
13.33%
1 gen 1973 anni
244.0
-368.0
-60.13%
1 gen 1975 anni
360.0
+116.0
47.54%
1 gen 1977 anni
275.0
-85.0
-23.61%
1 gen 1978 anni
444.0
+169.0
61.45%
1 gen 1980 anni
178.0
-266.0
-59.91%
1 gen 1981 anni
324.0
+146.0
82.02%
1 gen 1983 anni
254.0
-70.0
-21.6%
1 gen 1989 anni
234.0
-20.0
-7.87%
1 gen 1990 anni
279.0
+45.0
19.23%
1 gen 1999 anni
412.0
+133.0
47.67%
1 gen 2000 anni
620.0
+208.0
50.49%
1 gen 2001 anni
620.0
0.0
0.0%
1 gen 2002 anni
459.0
-161.0
-25.97%
1 gen 2003 anni
415.0
-44.0
-9.59%
1 gen 2004 anni
436.0
+21.0
5.06%
1 gen 2005 anni
382.0
-54.0
-12.39%
1 gen 2006 anni
310.0
-72.0
-18.85%
1 gen 2007 anni
461.0
+151.0
48.71%
1 gen 2008 anni
509.0
+48.0
10.41%
Classificazione dei paesi secondo i statistiche attuali per anni
