29
/it/
it
AIzaSyAYiBZKx7MnpbEhh9jyipgxe19OcubqV5w
April 1, 2024
131277
Ethiopia
ETH
true
2
1
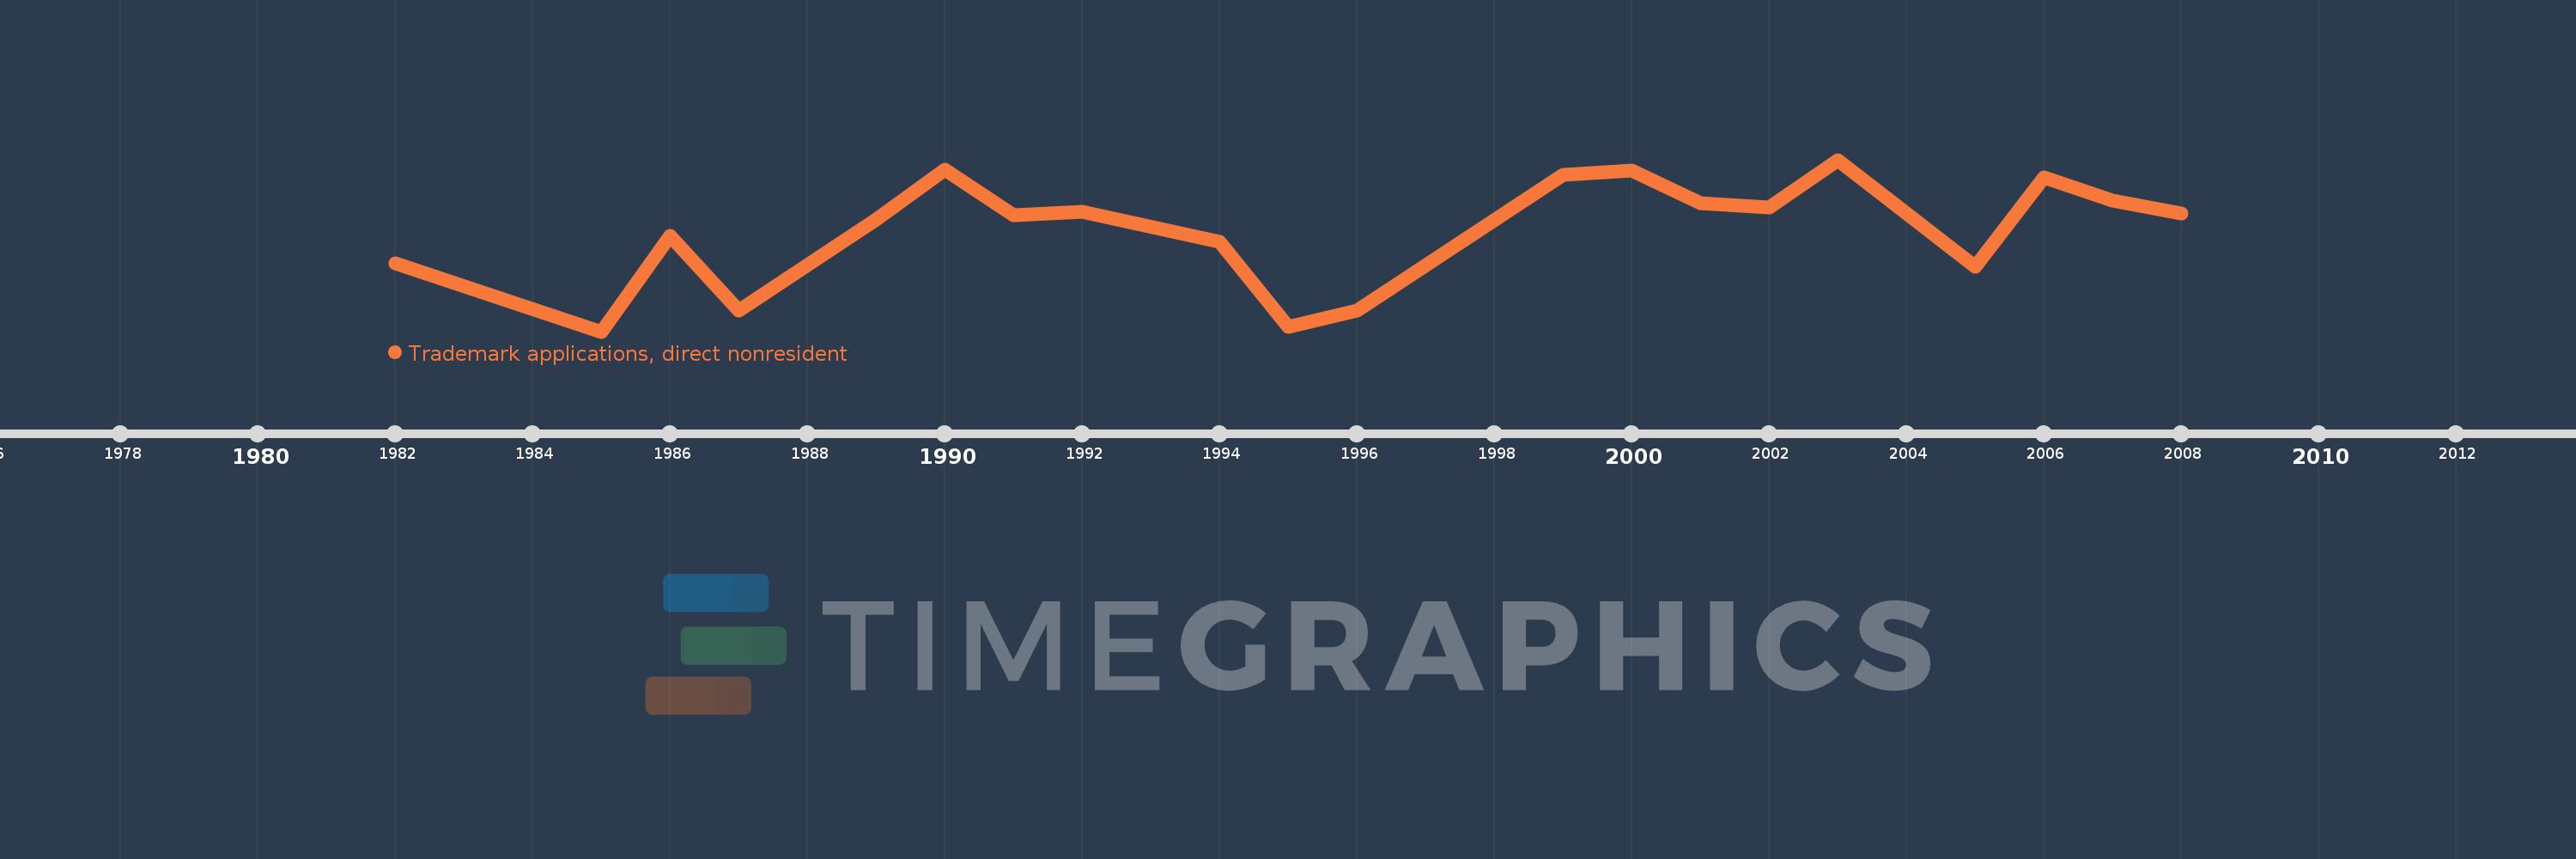
Trademark applications, direct nonresident
2008,2007,2006,2005,2004,2003,2002,2001,2000,1999,1996,1995,1994,1992,1991,1990,1989,1987,1986,1985,1982
Queste statistiche in altri paesi:
AlbaniaAlgeriaAndorraAngolaAntigua and BarbudaArab WorldArgentinaArmeniaArubaAustraliaAustriaAzerbaijanBahamas, TheBahrainBangladeshBarbadosBelarusBelgiumBelizeBhutanBoliviaBosnia and HerzegovinaBotswanaBrazilBrunei DarussalamBulgariaBurundiCambodiaCanadaCaribbean small statesCentral Europe and the BalticsChileChinaColombiaCongo, Dem. Rep.Costa RicaCroatiaCubaCuracaoCyprusCzech RepublicDenmarkDjiboutiDominicaDominican RepublicEarly-demographic dividendEast Asia & PacificEast Asia & Pacific (excluding high income)East Asia & Pacific (IDA & IBRD countries)EcuadorEgypt, Arab Rep.El SalvadorEstoniaEthiopiaEuro areaEurope & Central AsiaEurope & Central Asia (excluding high income)Europe & Central Asia (IDA & IBRD countries)European UnionFijiFinlandFranceGambia, TheGeorgiaGermanyGhanaGreeceGrenadaGuatemalaGuyanaHaitiHigh incomeHondurasHong Kong SAR, ChinaHungaryIBRD onlyIcelandIDA & IBRD totalIDA blendIndiaIndonesiaIran, Islamic Rep.IraqIrelandIsraelItalyJamaicaJapanJordanKazakhstanKenyaKiribatiKorea, Dem. People’s Rep.Korea, Rep.KuwaitKyrgyz RepublicLao PDRLate-demographic dividendLatin America & Caribbean Latin America & Caribbean (excluding high income)Latin America & the Caribbean (IDA & IBRD countries)LatviaLebanonLesothoLiberiaLibyaLiechtensteinLithuaniaLow & middle incomeLower middle incomeLuxembourgMacao SAR, ChinaMacedonia, FYRMadagascarMalawiMalaysiaMaliMaltaMauritiusMexicoMiddle East & North AfricaMiddle East & North Africa (excluding high income)Middle East & North Africa (IDA & IBRD countries)Middle incomeMoldovaMonacoMongoliaMontenegroMoroccoMozambiqueMyanmarNamibiaNepalNetherlandsNew ZealandNicaraguaNigeriaNorth AmericaNorwayOECD membersOmanOther small statesPacific island small statesPakistanPanamaPapua New GuineaParaguayPeruPhilippinesPolandPortugalPost-demographic dividendQatarRomaniaRussian FederationRwandaSamoaSan MarinoSao Tome and PrincipeSaudi ArabiaSerbiaSeychellesSierra LeoneSingaporeSint Maarten (Dutch part)Slovak RepublicSloveniaSmall statesSolomon IslandsSomaliaSouth AfricaSouth AsiaSouth Asia (IDA & IBRD)SpainSri LankaSt. LuciaSt. Vincent and the GrenadinesSudanSurinameSwazilandSwedenSwitzerlandSyrian Arab RepublicTajikistanTanzaniaThailandTongaTrinidad and TobagoTunisiaTurkeyTurkmenistanTuvaluUgandaUkraineUnited Arab EmiratesUnited KingdomUnited StatesUpper middle incomeUruguayUzbekistanVenezuela, RBVietnamWorldYemen, Rep.ZambiaZimbabwe Linea del tempo:
Questa scala temporale mostra un grafico dal 1982 anno al 2008 anno. Ethiopia. I dati fino ad 1981 anno non disponibili. Il numero di osservazioni attuali secondo i date: 21.
La fonte (nome):
Indicatori dello sviluppo mondiale
La fonte (organizzazione):
World Intellectual Property Organization (WIPO), WIPO Patent Report: Statistics on Worldwide Patent Activity. The International Bureau of WIPO assumes no responsibility with respect to the transformation of these data.
Categorie:
Science & Technology
sono stati aggiornati
23 apr 2017 anni
Indicatori delle variazioni dei valori per anni
Minima:
62.0
1 gen 1985 anni
Massimo:
398.0
1 gen 2003 anni
Alla data di osservazione
Valore
Variazione assoluta
La variazione rispetto al valore precedente
1 gen 1982 anni
195.0
+195.0
0.0%
1 gen 1985 anni
62.0
-133.0
-68.21%
1 gen 1986 anni
249.0
+187.0
301.61%
1 gen 1987 anni
103.0
-146.0
-58.63%
1 gen 1989 anni
282.0
+179.0
173.79%
1 gen 1990 anni
378.0
+96.0
34.04%
1 gen 1991 anni
289.0
-89.0
-23.54%
1 gen 1992 anni
296.0
+7.0
2.42%
1 gen 1994 anni
238.0
-58.0
-19.59%
1 gen 1995 anni
72.0
-166.0
-69.75%
1 gen 1996 anni
103.0
+31.0
43.06%
1 gen 1999 anni
368.0
+265.0
257.28%
1 gen 2000 anni
377.0
+9.0
2.45%
1 gen 2001 anni
313.0
-64.0
-16.98%
1 gen 2002 anni
305.0
-8.0
-2.56%
1 gen 2003 anni
398.0
+93.0
30.49%
1 gen 2004 anni
293.0
-105.0
-26.38%
1 gen 2005 anni
189.0
-104.0
-35.49%
1 gen 2006 anni
363.0
+174.0
92.06%
1 gen 2007 anni
319.0
-44.0
-12.12%
1 gen 2008 anni
293.0
-26.0
-8.15%
Classificazione dei paesi secondo i statistiche attuali per anni


Commenti: