29
/it/
it
AIzaSyAYiBZKx7MnpbEhh9jyipgxe19OcubqV5w
April 1, 2024
26140
Central Europe and the Baltics
CEB
false
2
1
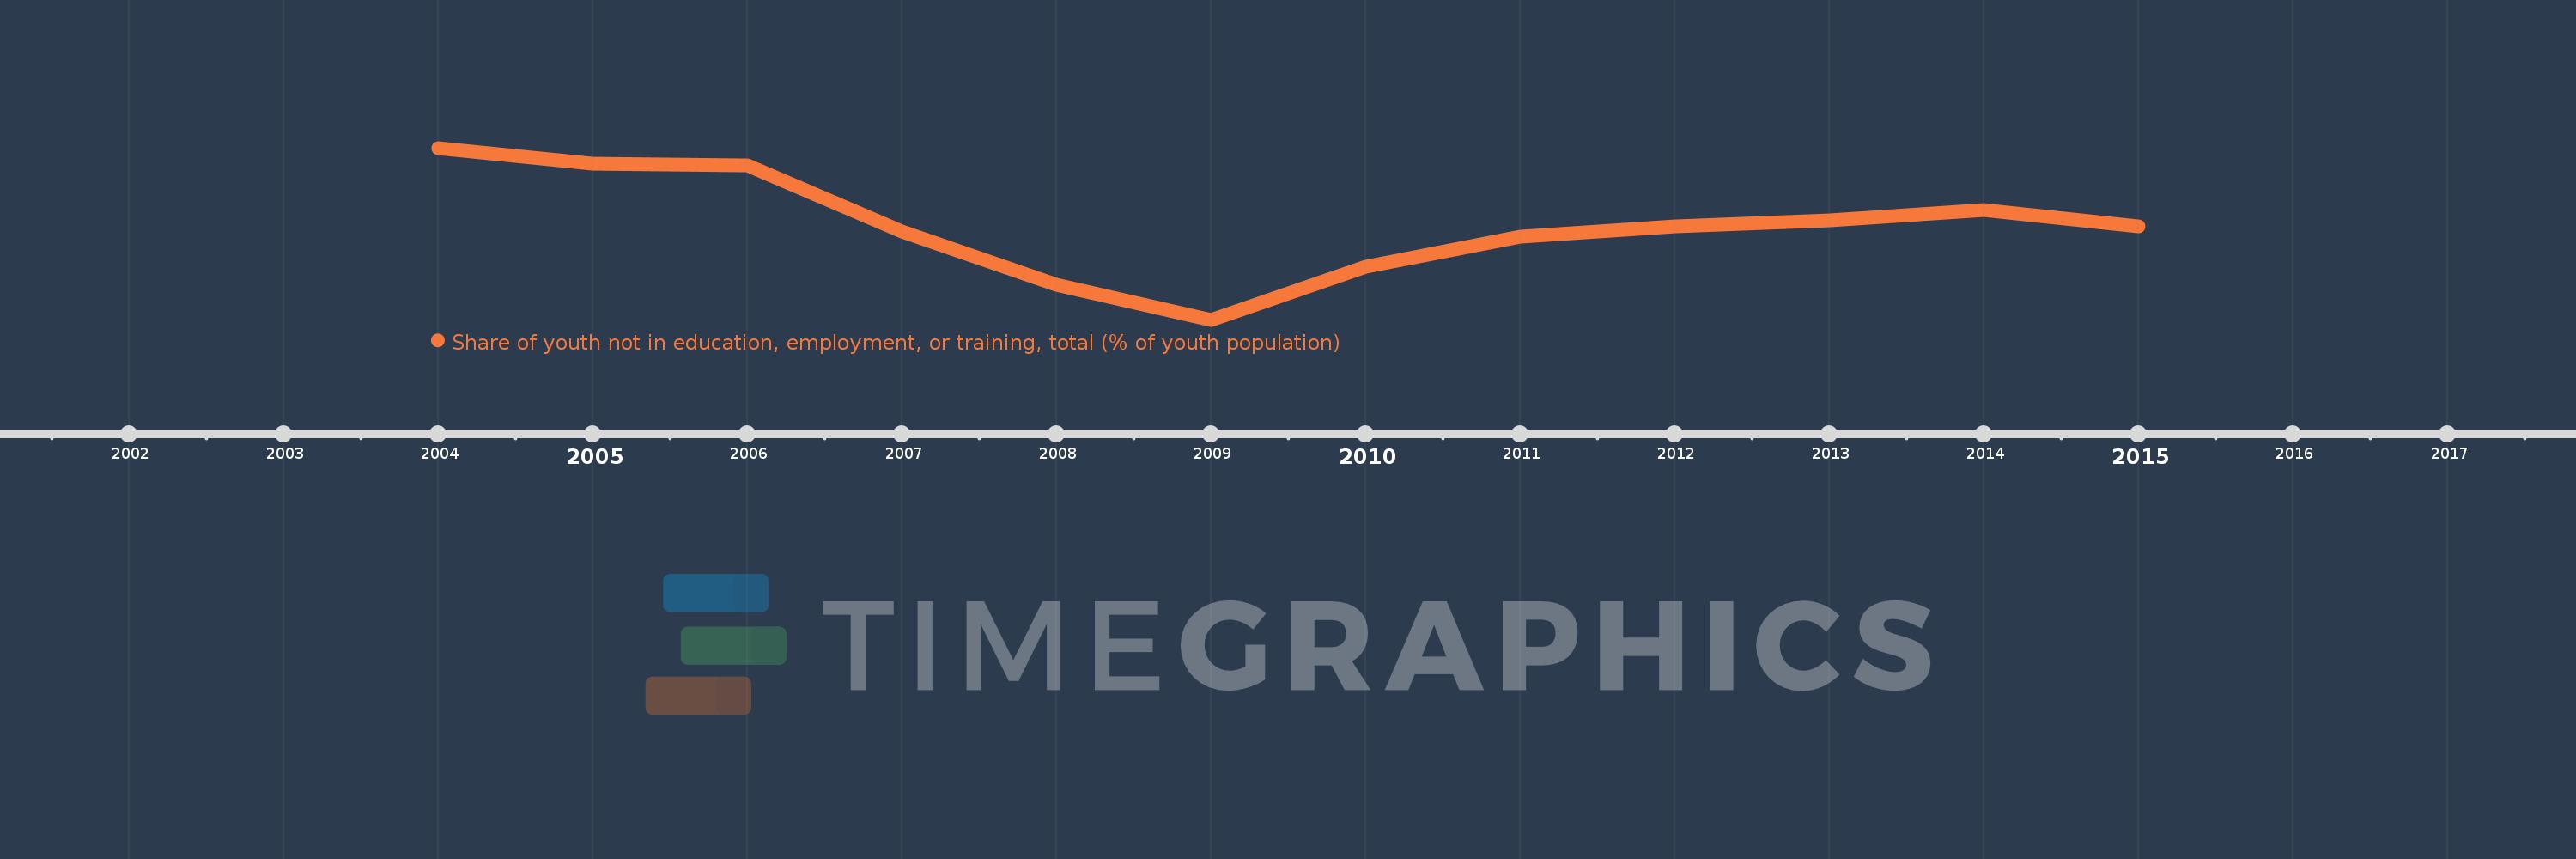
Share of youth not in education, employment, or training, total (% of youth population)
2015,2014,2013,2012,2011,2010,2009,2008,2007,2006,2005,2004
Queste statistiche in altri paesi:
Linea del tempo:
Questa scala temporale mostra un grafico dal 2004 anno al 2015 anno. Central Europe and the Baltics. I dati fino ad 2003 anno non disponibili. Il numero di osservazioni attuali secondo i date: 12.
La fonte (nome):
Indicatori dello sviluppo mondiale
La fonte (organizzazione):
International Labour Organization, Key Indicators of the Labour Market database.
Categorie:
Social Protection & Labor
sono stati aggiornati
23 apr 2017 anni
Indicatori delle variazioni dei valori per anni
Minima:
10.26
1 gen 2009 anni
Massimo:
16.055
1 gen 2004 anni
Alla data di osservazione
Valore
Variazione assoluta
La variazione rispetto al valore precedente
1 gen 2004 anni
16.055
+16.055
0.0%
1 gen 2005 anni
15.537
-0.518
-3.22%
1 gen 2006 anni
15.476
-0.061
-0.39%
1 gen 2007 anni
13.23
-2.246
-14.51%
1 gen 2008 anni
11.44
-1.789
-13.52%
1 gen 2009 anni
10.26
-1.18
-10.32%
1 gen 2010 anni
12.04
+1.78
17.35%
1 gen 2011 anni
13.053
+1.013
8.42%
1 gen 2012 anni
13.397
+0.344
2.63%
1 gen 2013 anni
13.613
+0.216
1.61%
1 gen 2014 anni
13.958
+0.344
2.53%
1 gen 2015 anni
13.423
-0.534
-3.83%
Classificazione dei paesi secondo i statistiche attuali per anni


Commenti: