29
/fr/
fr
AIzaSyAYiBZKx7MnpbEhh9jyipgxe19OcubqV5w
April 1, 2024
26140
Central Europe and the Baltics
CEB
false
2
1
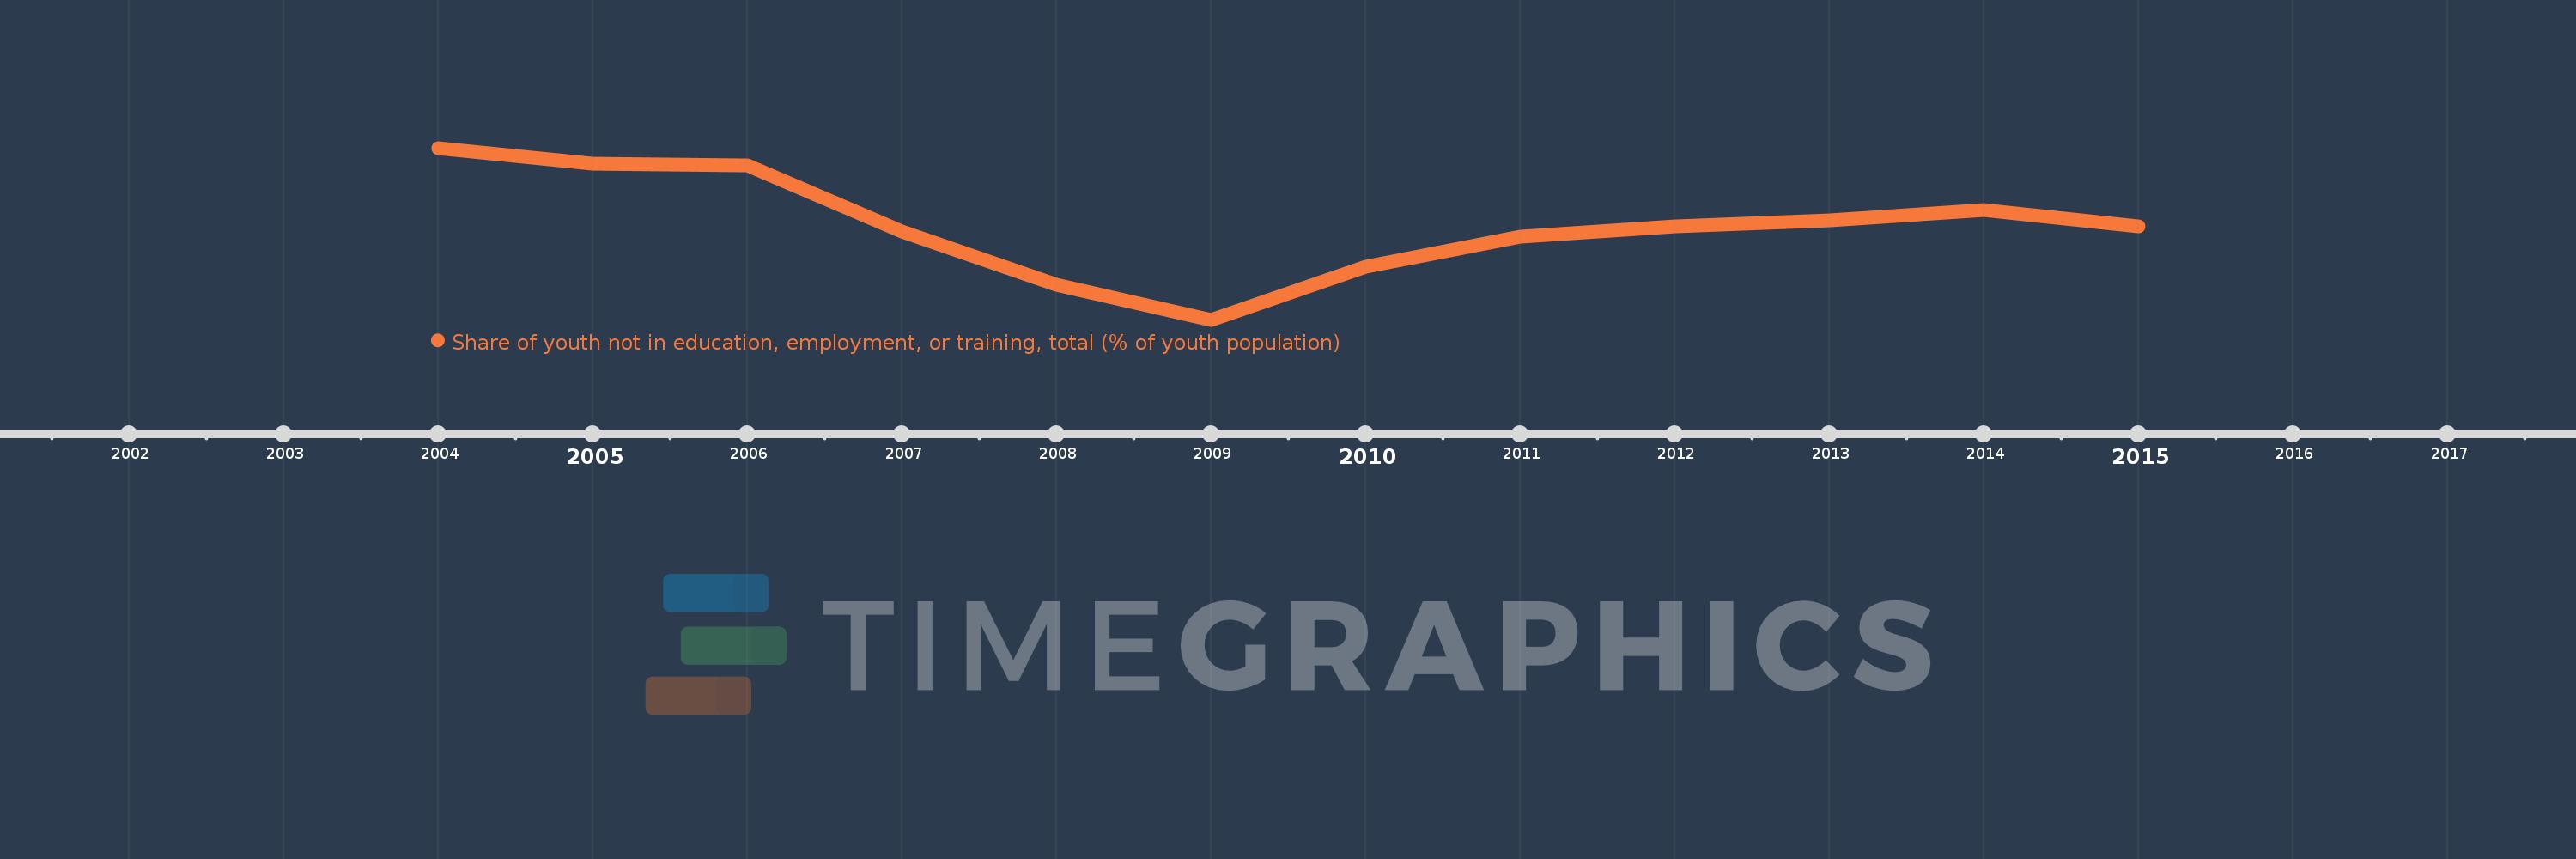
Share of youth not in education, employment, or training, total (% of youth population)
2015,2014,2013,2012,2011,2010,2009,2008,2007,2006,2005,2004
Cette statistique dans les autres pays:
La ligne de temps
Cette échelle de temps montre un graphique de 2004 année à 2015 année Central Europe and the Baltics. Les données jusqu'à 2003 année ne sont pas présentés. Quantité d'observations actuelles selon dates: 12.
Source (désignation):
Les indicateurs du développement mondiale
Source (organisation):
International Labour Organization, Key Indicators of the Labour Market database.
Catégories:
Social Protection & Labor
Dernière mise à jour
23 avr. 2017
Les indicateurs de changement de valeurs selon les années
Minimum:
10.26
1 janv. 2009
Maximum:
16.055
1 janv. 2004
Pour la date d''observation
Valeur
Changement absolu
Le changement par rapport à la valeur précédente
1 janv. 2004
16.055
+16.055
0.0%
1 janv. 2005
15.537
-0.518
-3.22%
1 janv. 2006
15.476
-0.061
-0.39%
1 janv. 2007
13.23
-2.246
-14.51%
1 janv. 2008
11.44
-1.789
-13.52%
1 janv. 2009
10.26
-1.18
-10.32%
1 janv. 2010
12.04
+1.78
17.35%
1 janv. 2011
13.053
+1.013
8.42%
1 janv. 2012
13.397
+0.344
2.63%
1 janv. 2013
13.613
+0.216
1.61%
1 janv. 2014
13.958
+0.344
2.53%
1 janv. 2015
13.423
-0.534
-3.83%
Classement des pays selon les statistiques actuelles par années


Commentaires: