29
/it/
it
AIzaSyAYiBZKx7MnpbEhh9jyipgxe19OcubqV5w
April 1, 2024
257989
Syrian Arab Republic
SYR
true
2
1
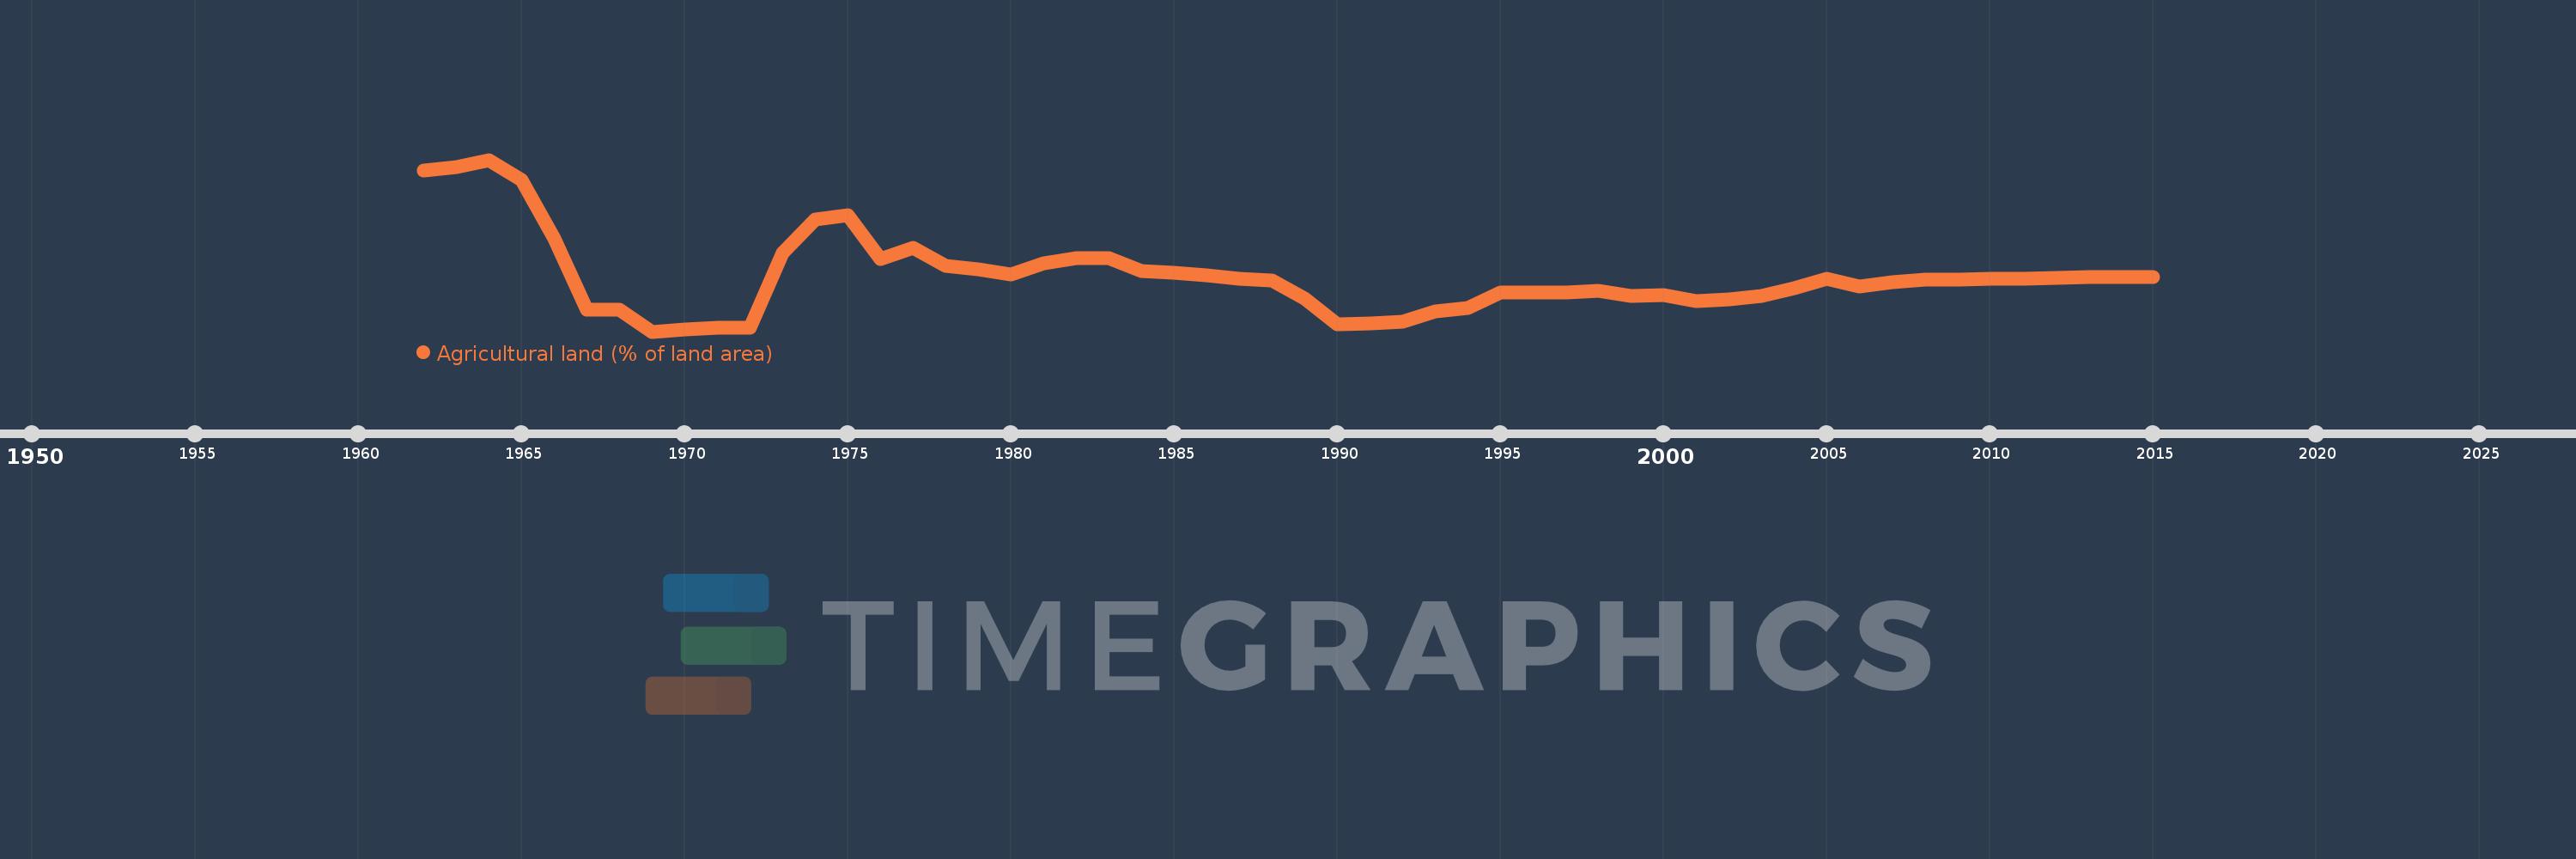
Agricultural land (% of land area)
2015,2014,2013,2012,2011,2010,2009,2008,2007,2006,2005,2004,2003,2002,2001,2000,1999,1998,1997,1996,1995,1994,1993,1992,1991,1990,1989,1988,1987,1986,1985,1984,1983,1982,1981,1980,1979,1978,1977,1976,1975,1974,1973,1972,1971,1970,1969,1968,1967,1966,1965,1964,1963,1962
Queste statistiche in altri paesi:
AfghanistanAlbaniaAlgeriaAmerican SamoaAndorraAngolaAntigua and BarbudaArab WorldArgentinaArmeniaArubaAustraliaAustriaAzerbaijanBahamas, TheBahrainBangladeshBarbadosBelarusBelgiumBelizeBeninBermudaBhutanBoliviaBosnia and HerzegovinaBotswanaBrazilBritish Virgin IslandsBrunei DarussalamBulgariaBurkina FasoBurundiCabo VerdeCambodiaCameroonCanadaCaribbean small statesCayman IslandsCentral African RepublicCentral Europe and the BalticsChadChannel IslandsChileChinaColombiaComorosCongo, Dem. Rep.Congo, Rep.Costa RicaCote d'IvoireCroatiaCubaCyprusCzech RepublicDenmarkDjiboutiDominicaDominican RepublicEarly-demographic dividendEast Asia & PacificEast Asia & Pacific (excluding high income)East Asia & Pacific (IDA & IBRD countries)EcuadorEgypt, Arab Rep.El SalvadorEquatorial GuineaEritreaEstoniaEthiopiaEuro areaEurope & Central AsiaEurope & Central Asia (excluding high income)Europe & Central Asia (IDA & IBRD countries)European UnionFaroe IslandsFijiFinlandFragile and conflict affected situationsFranceFrench PolynesiaGabonGambia, TheGeorgiaGermanyGhanaGreeceGreenlandGrenadaGuamGuatemalaGuineaGuinea-BissauGuyanaHaitiHeavily indebted poor countries (HIPC)High incomeHondurasHong Kong SAR, ChinaHungaryIBRD onlyIcelandIDA & IBRD totalIDA blendIDA onlyIDA totalIndiaIndonesiaIran, Islamic Rep.IraqIrelandIsle of ManIsraelItalyJamaicaJapanJordanKazakhstanKenyaKiribatiKorea, Dem. People’s Rep.Korea, Rep.KosovoKuwaitKyrgyz RepublicLao PDRLate-demographic dividendLatin America & Caribbean Latin America & Caribbean (excluding high income)Latin America & the Caribbean (IDA & IBRD countries)LatviaLeast developed countries: UN classificationLebanonLesothoLiberiaLibyaLiechtensteinLithuaniaLow & middle incomeLow incomeLower middle incomeLuxembourgMacedonia, FYRMadagascarMalawiMalaysiaMaldivesMaliMaltaMarshall IslandsMauritaniaMauritiusMexicoMicronesia, Fed. Sts.Middle East & North AfricaMiddle East & North Africa (excluding high income)Middle East & North Africa (IDA & IBRD countries)Middle incomeMoldovaMongoliaMontenegroMoroccoMozambiqueMyanmarNamibiaNauruNepalNetherlandsNew CaledoniaNew ZealandNicaraguaNigerNigeriaNorth AmericaNorthern Mariana IslandsNorwayOECD membersOmanOther small statesPacific island small statesPakistanPalauPanamaPapua New GuineaParaguayPeruPhilippinesPolandPortugalPost-demographic dividendPre-demographic dividendPuerto RicoQatarRomaniaRussian FederationRwandaSamoaSan MarinoSao Tome and PrincipeSaudi ArabiaSenegalSerbiaSeychellesSierra LeoneSingaporeSlovak RepublicSloveniaSmall statesSolomon IslandsSomaliaSouth AfricaSouth AsiaSouth Asia (IDA & IBRD)SpainSri LankaSt. Kitts and NevisSt. LuciaSt. Vincent and the GrenadinesSub-Saharan Africa Sub-Saharan Africa (excluding high income)Sub-Saharan Africa (IDA & IBRD countries)SudanSurinameSwazilandSwedenSwitzerlandSyrian Arab RepublicTajikistanTanzaniaThailandTimor-LesteTogoTongaTrinidad and TobagoTunisiaTurkeyTurkmenistanTurks and Caicos IslandsTuvaluUgandaUkraineUnited Arab EmiratesUnited KingdomUnited StatesUpper middle incomeUruguayUzbekistanVanuatuVenezuela, RBVietnamVirgin Islands (U.S.)West Bank and GazaWorldYemen, Rep.ZambiaZimbabwe Linea del tempo:
Questa scala temporale mostra un grafico dal 1962 anno al 2015 anno. Syrian Arab Republic. I dati fino ad 1961 anno non disponibili. Il numero di osservazioni attuali secondo i date: 54.
La fonte (nome):
Indicatori dello sviluppo mondiale
La fonte (organizzazione):
Food and Agriculture Organization, electronic files and web site.
Categorie:
Agriculture & Rural Development, Climate Change, Environment
sono stati aggiornati
23 apr 2017 anni
Indicatori delle variazioni dei valori per anni
Minima:
73.028
1 gen 1969 anni
Massimo:
81.842
1 gen 1964 anni
Alla data di osservazione
Valore
Variazione assoluta
La variazione rispetto al valore precedente
1 gen 1962 anni
81.298
+81.298
0.0%
1 gen 1963 anni
81.456
+0.158
0.19%
1 gen 1964 anni
81.842
+0.386
0.47%
1 gen 1965 anni
80.825
-1.018
-1.24%
1 gen 1966 anni
77.805
-3.02
-3.74%
1 gen 1967 anni
74.165
-3.64
-4.68%
1 gen 1968 anni
74.165
0.0
0.0%
1 gen 1969 anni
73.028
-1.137
-1.53%
1 gen 1970 anni
73.158
+0.131
0.18%
1 gen 1971 anni
73.234
+0.076
0.1%
1 gen 1972 anni
73.229
-0.005
-0.01%
1 gen 1973 anni
77.054
+3.825
5.22%
1 gen 1974 anni
78.779
+1.725
2.24%
1 gen 1975 anni
78.991
+0.212
0.27%
1 gen 1976 anni
76.76
-2.231
-2.82%
1 gen 1977 anni
77.337
+0.577
0.75%
1 gen 1978 anni
76.396
-0.941
-1.22%
1 gen 1979 anni
76.227
-0.169
-0.22%
1 gen 1980 anni
75.96
-0.267
-0.35%
1 gen 1981 anni
76.515
+0.555
0.73%
1 gen 1982 anni
76.804
+0.288
0.38%
1 gen 1983 anni
76.793
-0.011
-0.01%
1 gen 1984 anni
76.129
-0.664
-0.86%
1 gen 1985 anni
76.031
-0.098
-0.13%
1 gen 1986 anni
75.911
-0.12
-0.16%
1 gen 1987 anni
75.743
-0.169
-0.22%
1 gen 1988 anni
75.672
-0.071
-0.09%
1 gen 1989 anni
74.725
-0.947
-1.25%
1 gen 1990 anni
73.414
-1.311
-1.75%
1 gen 1991 anni
73.43
+0.016
0.02%
1 gen 1992 anni
73.523
+0.093
0.13%
1 gen 1993 anni
74.072
+0.55
0.75%
1 gen 1994 anni
74.23
+0.158
0.21%
1 gen 1995 anni
75.014
+0.784
1.06%
1 gen 1996 anni
75.03
+0.016
0.02%
1 gen 1997 anni
75.035
+0.005
0.01%
1 gen 1998 anni
75.112
+0.076
0.1%
1 gen 1999 anni
74.839
-0.272
-0.36%
1 gen 2000 anni
74.91
+0.071
0.09%
1 gen 2001 anni
74.606
-0.305
-0.41%
1 gen 2002 anni
74.671
+0.065
0.09%
1 gen 2003 anni
74.867
+0.196
0.26%
1 gen 2004 anni
75.238
+0.372
0.5%
1 gen 2005 anni
75.748
+0.509
0.68%
1 gen 2006 anni
75.328
-0.419
-0.55%
1 gen 2007 anni
75.57
+0.242
0.32%
1 gen 2008 anni
75.675
+0.105
0.14%
1 gen 2009 anni
75.681
+0.005
0.01%
1 gen 2010 anni
75.735
+0.054
0.07%
1 gen 2011 anni
75.739
+0.004
0.01%
1 gen 2012 anni
75.777
+0.038
0.05%
1 gen 2013 anni
75.81
+0.033
0.04%
1 gen 2014 anni
75.81
0.0
0.0%
1 gen 2015 anni
75.81
0.0
0.0%
Classificazione dei paesi secondo i statistiche attuali per anni


Commenti: