29
/it/
it
AIzaSyAYiBZKx7MnpbEhh9jyipgxe19OcubqV5w
April 1, 2024
136375
Gambia, The
GMB
true
2
1
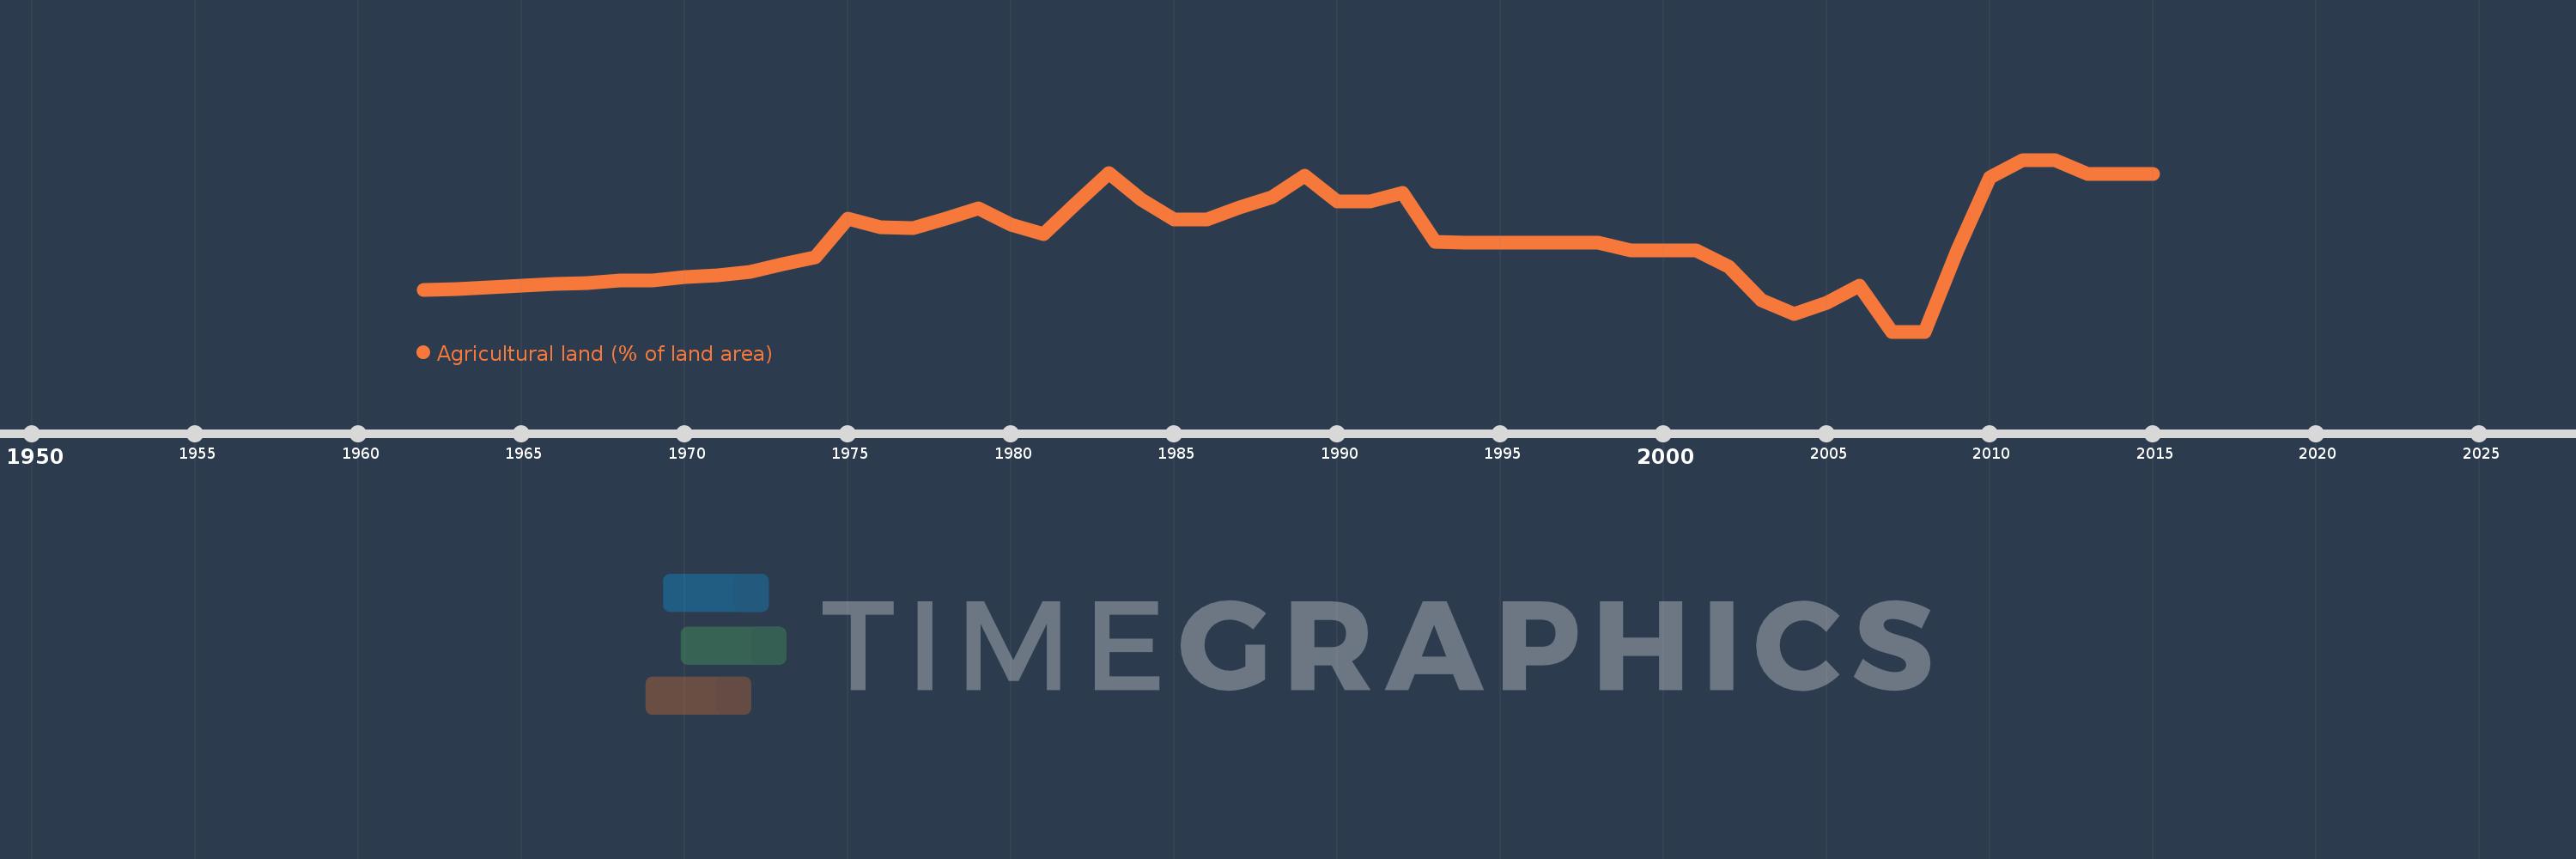
Agricultural land (% of land area)
2015,2014,2013,2012,2011,2010,2009,2008,2007,2006,2005,2004,2003,2002,2001,2000,1999,1998,1997,1996,1995,1994,1993,1992,1991,1990,1989,1988,1987,1986,1985,1984,1983,1982,1981,1980,1979,1978,1977,1976,1975,1974,1973,1972,1971,1970,1969,1968,1967,1966,1965,1964,1963,1962
Queste statistiche in altri paesi:
AfghanistanAlbaniaAlgeriaAmerican SamoaAndorraAngolaAntigua and BarbudaArab WorldArgentinaArmeniaArubaAustraliaAustriaAzerbaijanBahamas, TheBahrainBangladeshBarbadosBelarusBelgiumBelizeBeninBermudaBhutanBoliviaBosnia and HerzegovinaBotswanaBrazilBritish Virgin IslandsBrunei DarussalamBulgariaBurkina FasoBurundiCabo VerdeCambodiaCameroonCanadaCaribbean small statesCayman IslandsCentral African RepublicCentral Europe and the BalticsChadChannel IslandsChileChinaColombiaComorosCongo, Dem. Rep.Congo, Rep.Costa RicaCote d'IvoireCroatiaCubaCyprusCzech RepublicDenmarkDjiboutiDominicaDominican RepublicEarly-demographic dividendEast Asia & PacificEast Asia & Pacific (excluding high income)East Asia & Pacific (IDA & IBRD countries)EcuadorEgypt, Arab Rep.El SalvadorEquatorial GuineaEritreaEstoniaEthiopiaEuro areaEurope & Central AsiaEurope & Central Asia (excluding high income)Europe & Central Asia (IDA & IBRD countries)European UnionFaroe IslandsFijiFinlandFragile and conflict affected situationsFranceFrench PolynesiaGabonGambia, TheGeorgiaGermanyGhanaGreeceGreenlandGrenadaGuamGuatemalaGuineaGuinea-BissauGuyanaHaitiHeavily indebted poor countries (HIPC)High incomeHondurasHong Kong SAR, ChinaHungaryIBRD onlyIcelandIDA & IBRD totalIDA blendIDA onlyIDA totalIndiaIndonesiaIran, Islamic Rep.IraqIrelandIsle of ManIsraelItalyJamaicaJapanJordanKazakhstanKenyaKiribatiKorea, Dem. People’s Rep.Korea, Rep.KosovoKuwaitKyrgyz RepublicLao PDRLate-demographic dividendLatin America & Caribbean Latin America & Caribbean (excluding high income)Latin America & the Caribbean (IDA & IBRD countries)LatviaLeast developed countries: UN classificationLebanonLesothoLiberiaLibyaLiechtensteinLithuaniaLow & middle incomeLow incomeLower middle incomeLuxembourgMacedonia, FYRMadagascarMalawiMalaysiaMaldivesMaliMaltaMarshall IslandsMauritaniaMauritiusMexicoMicronesia, Fed. Sts.Middle East & North AfricaMiddle East & North Africa (excluding high income)Middle East & North Africa (IDA & IBRD countries)Middle incomeMoldovaMongoliaMontenegroMoroccoMozambiqueMyanmarNamibiaNauruNepalNetherlandsNew CaledoniaNew ZealandNicaraguaNigerNigeriaNorth AmericaNorthern Mariana IslandsNorwayOECD membersOmanOther small statesPacific island small statesPakistanPalauPanamaPapua New GuineaParaguayPeruPhilippinesPolandPortugalPost-demographic dividendPre-demographic dividendPuerto RicoQatarRomaniaRussian FederationRwandaSamoaSan MarinoSao Tome and PrincipeSaudi ArabiaSenegalSerbiaSeychellesSierra LeoneSingaporeSlovak RepublicSloveniaSmall statesSolomon IslandsSomaliaSouth AfricaSouth AsiaSouth Asia (IDA & IBRD)SpainSri LankaSt. Kitts and NevisSt. LuciaSt. Vincent and the GrenadinesSub-Saharan Africa Sub-Saharan Africa (excluding high income)Sub-Saharan Africa (IDA & IBRD countries)SudanSurinameSwazilandSwedenSwitzerlandSyrian Arab RepublicTajikistanTanzaniaThailandTimor-LesteTogoTongaTrinidad and TobagoTunisiaTurkeyTurkmenistanTurks and Caicos IslandsTuvaluUgandaUkraineUnited Arab EmiratesUnited KingdomUnited StatesUpper middle incomeUruguayUzbekistanVanuatuVenezuela, RBVietnamVirgin Islands (U.S.)West Bank and GazaWorldYemen, Rep.ZambiaZimbabwe Linea del tempo:
Questa scala temporale mostra un grafico dal 1962 anno al 2015 anno. Gambia, The. I dati fino ad 1961 anno non disponibili. Il numero di osservazioni attuali secondo i date: 54.
La fonte (nome):
Indicatori dello sviluppo mondiale
La fonte (organizzazione):
Food and Agriculture Organization, electronic files and web site.
Categorie:
Agriculture & Rural Development, Climate Change, Environment
sono stati aggiornati
23 apr 2017 anni
Indicatori delle variazioni dei valori per anni
Minima:
48.913
1 gen 2007 anni
Massimo:
60.771
1 gen 2011 anni
Alla data di osservazione
Valore
Variazione assoluta
La variazione rispetto al valore precedente
1 gen 1962 anni
51.779
+51.779
0.0%
1 gen 1963 anni
51.877
+0.099
0.19%
1 gen 1964 anni
51.976
+0.099
0.19%
1 gen 1965 anni
52.075
+0.099
0.19%
1 gen 1966 anni
52.174
+0.099
0.19%
1 gen 1967 anni
52.273
+0.099
0.19%
1 gen 1968 anni
52.47
+0.198
0.38%
1 gen 1969 anni
52.47
0.0
0.0%
1 gen 1970 anni
52.668
+0.198
0.38%
1 gen 1971 anni
52.767
+0.099
0.19%
1 gen 1972 anni
53.063
+0.296
0.56%
1 gen 1973 anni
53.557
+0.494
0.93%
1 gen 1974 anni
54.051
+0.494
0.92%
1 gen 1975 anni
56.719
+2.668
4.94%
1 gen 1976 anni
56.126
-0.593
-1.05%
1 gen 1977 anni
56.028
-0.099
-0.18%
1 gen 1978 anni
56.719
+0.692
1.23%
1 gen 1979 anni
57.411
+0.692
1.22%
1 gen 1980 anni
56.324
-1.087
-1.89%
1 gen 1981 anni
55.632
-0.692
-1.23%
1 gen 1982 anni
57.806
+2.174
3.91%
1 gen 1983 anni
59.881
+2.075
3.59%
1 gen 1984 anni
58.004
-1.877
-3.14%
1 gen 1985 anni
56.621
-1.383
-2.39%
1 gen 1986 anni
56.621
0.0
0.0%
1 gen 1987 anni
57.51
+0.889
1.57%
1 gen 1988 anni
58.202
+0.692
1.2%
1 gen 1989 anni
59.684
+1.482
2.55%
1 gen 1990 anni
57.905
-1.779
-2.98%
1 gen 1991 anni
57.905
0.0
0.0%
1 gen 1992 anni
58.498
+0.593
1.02%
1 gen 1993 anni
55.138
-3.36
-5.74%
1 gen 1994 anni
55.04
-0.099
-0.18%
1 gen 1995 anni
55.04
0.0
0.0%
1 gen 1996 anni
55.04
0.0
0.0%
1 gen 1997 anni
55.04
0.0
0.0%
1 gen 1998 anni
55.04
0.0
0.0%
1 gen 1999 anni
54.545
-0.494
-0.9%
1 gen 2000 anni
54.545
0.0
0.0%
1 gen 2001 anni
54.545
0.0
0.0%
1 gen 2002 anni
53.36
-1.186
-2.17%
1 gen 2003 anni
51.087
-2.273
-4.26%
1 gen 2004 anni
50.099
-0.988
-1.93%
1 gen 2005 anni
50.889
+0.791
1.58%
1 gen 2006 anni
52.075
+1.186
2.33%
1 gen 2007 anni
48.913
-3.162
-6.07%
1 gen 2008 anni
48.913
0.0
0.0%
1 gen 2009 anni
54.545
+5.632
11.52%
1 gen 2010 anni
59.585
+5.04
9.24%
1 gen 2011 anni
60.771
+1.186
1.99%
1 gen 2012 anni
60.771
0.0
0.0%
1 gen 2013 anni
59.783
-0.988
-1.63%
1 gen 2014 anni
59.783
0.0
0.0%
1 gen 2015 anni
59.783
0.0
0.0%
Classificazione dei paesi secondo i statistiche attuali per anni


Commenti: