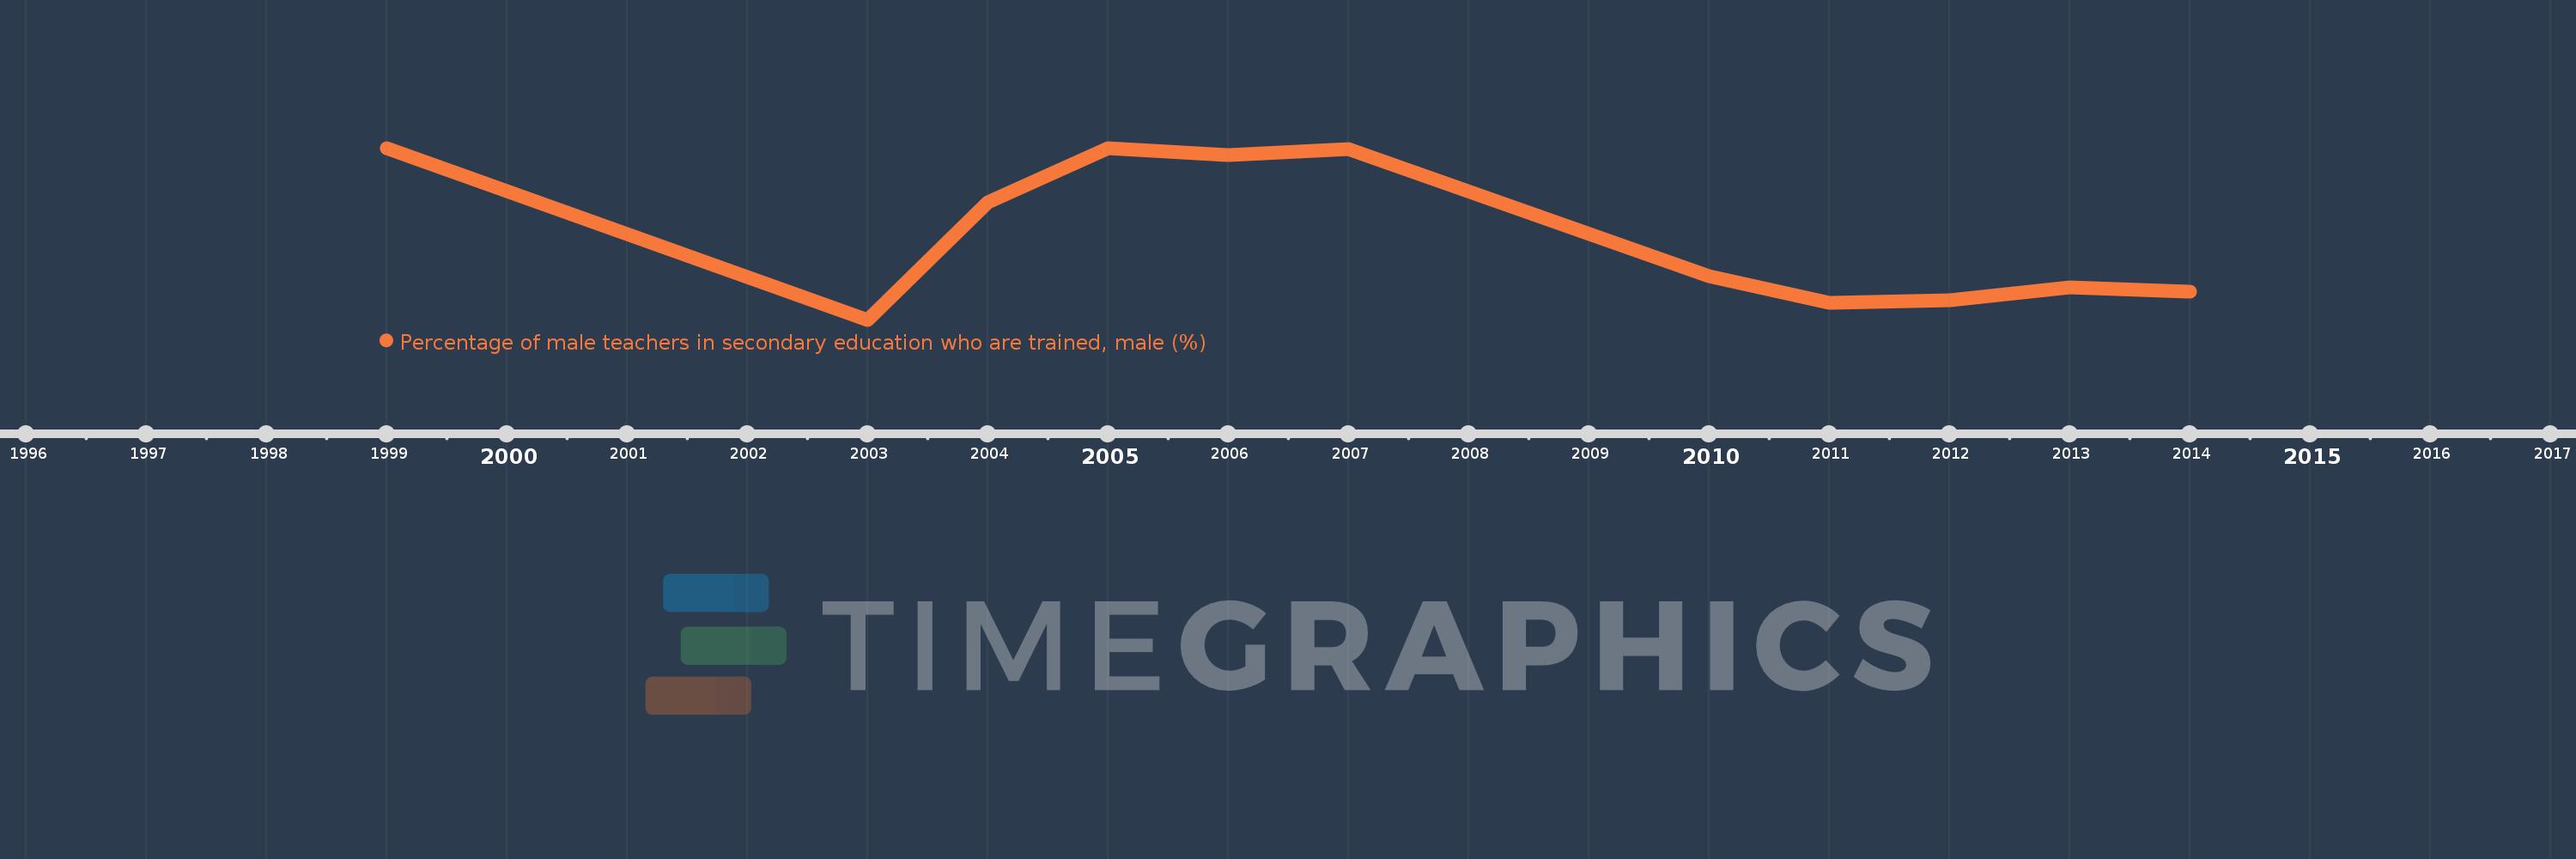
Questa scala temporale mostra un grafico dal 1999 anno al 2014 anno. Swaziland. I dati fino ad 1998 anno non disponibili. Il numero di osservazioni attuali secondo i date: 11.
La fonte (nome):
Indicatori dello sviluppo mondiale
La fonte (organizzazione):
UNESCO Institute for Statistics
Categorie:
Education
sono stati aggiornati
23 apr 2017 anni
Indicatori delle variazioni dei valori per anni
In media:
86.261
Minima:
73.343
1 gen 2003 anni
Massimo:
99.403
1 gen 1999 anni
Alla data di osservazione
Valore
Variazione assoluta
La variazione rispetto al valore precedente
1 gen 1999 anni
99.403
+99.403
0.0%
1 gen 2003 anni
73.343
-26.06
-26.22%
1 gen 2004 anni
91.199
+17.856
24.35%
1 gen 2005 anni
99.372
+8.173
8.96%
1 gen 2006 anni
98.286
-1.086
-1.09%
1 gen 2007 anni
99.286
+1.0
1.02%
1 gen 2010 anni
79.895
-19.391
-19.53%
1 gen 2011 anni
75.918
-3.977
-4.98%
1 gen 2012 anni
76.247
+0.329
0.43%
1 gen 2013 anni
78.261
+2.014
2.64%
1 gen 2014 anni
77.666
-0.595
-0.76%
Classificazione dei paesi secondo i statistiche attuali per anni
