29
/it/
it
AIzaSyAYiBZKx7MnpbEhh9jyipgxe19OcubqV5w
April 1, 2024
252408
St. Vincent and the Grenadines
VCT
true
2
1
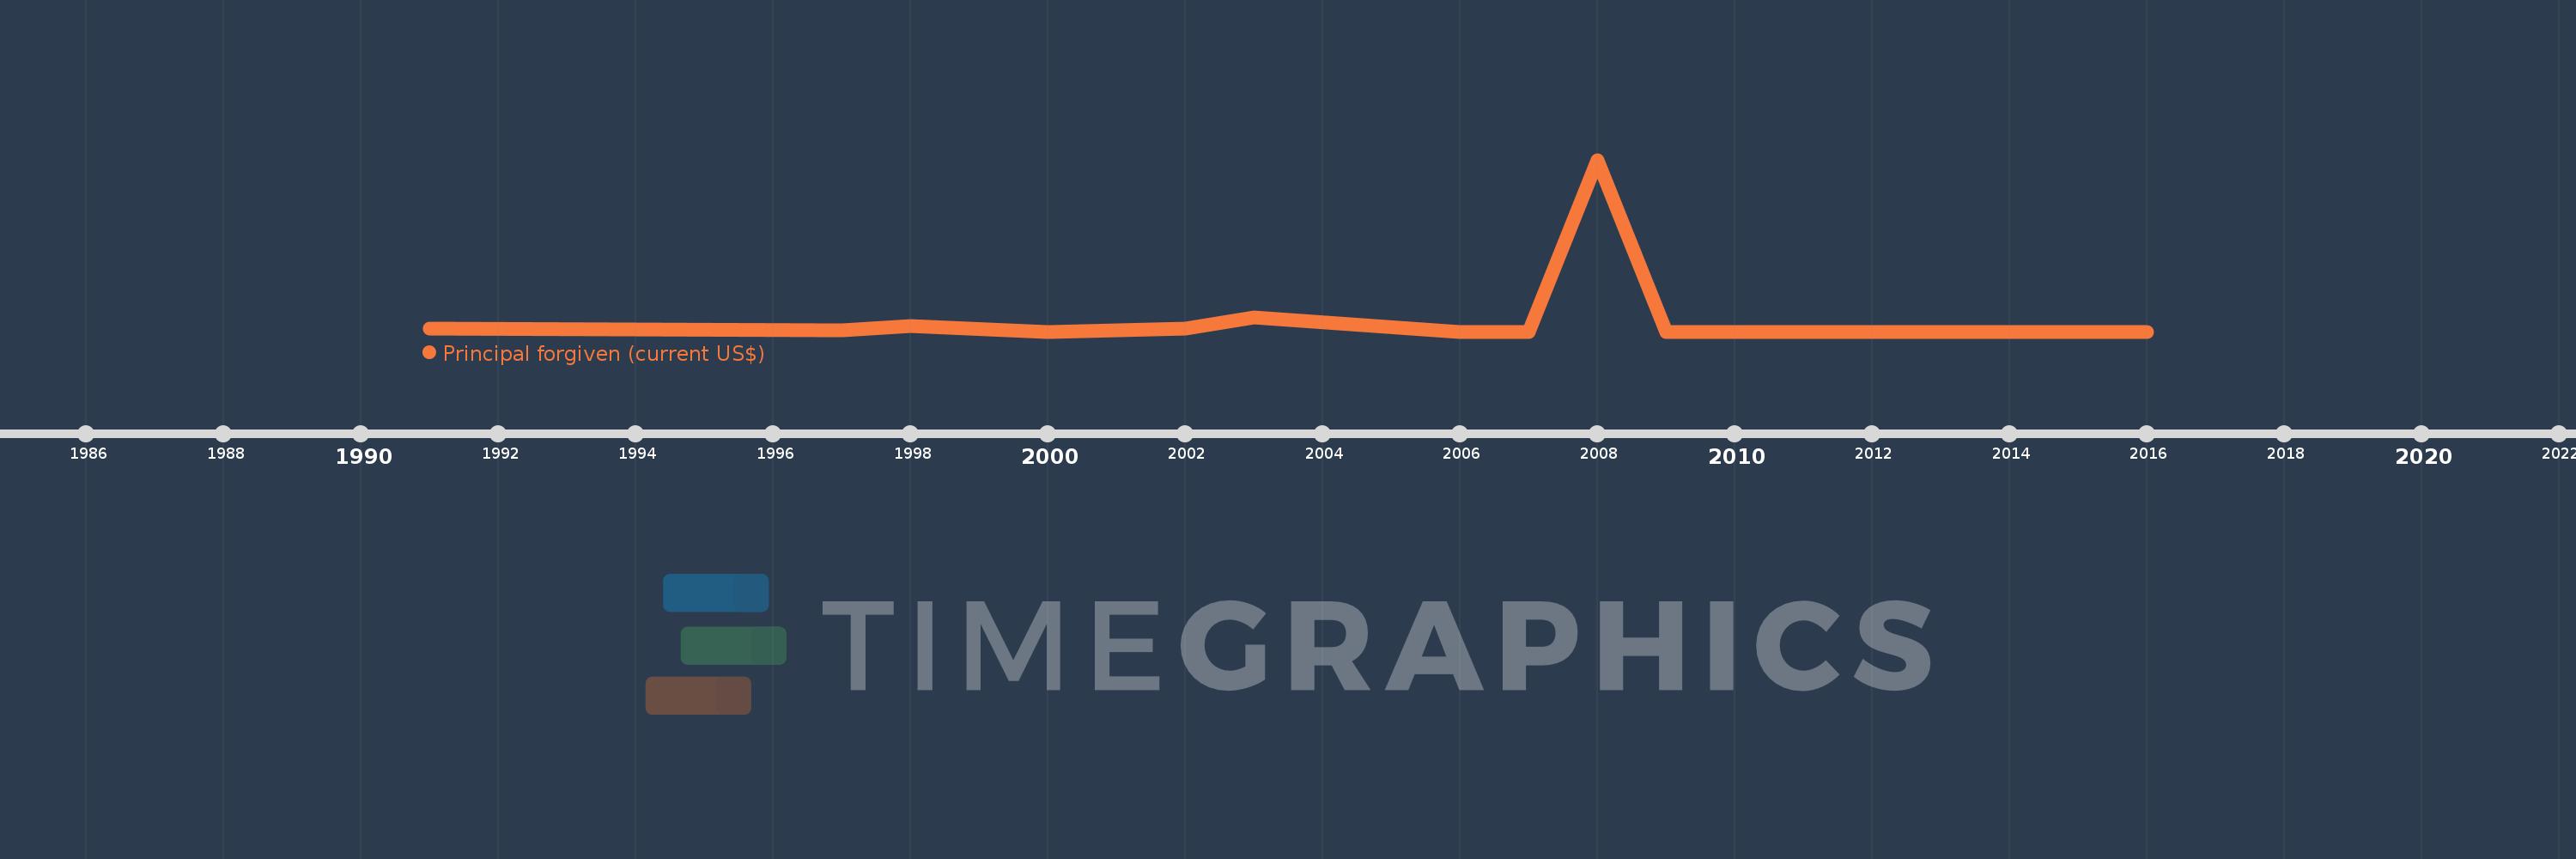
Principal forgiven (current US$)
2016,2015,2014,2013,2012,2011,2010,2009,2008,2007,2006,2003,2002,2000,1998,1997,1991
Queste statistiche in altri paesi:
Linea del tempo:
Questa scala temporale mostra un grafico dal 1991 anno al 2016 anno. St. Vincent and the Grenadines. I dati fino ad 1990 anno non disponibili. Il numero di osservazioni attuali secondo i date: 17.
La fonte (nome):
Indicatori dello sviluppo mondiale
La fonte (organizzazione):
World Bank, International Debt Statistics.
Categorie:
External Debt
sono stati aggiornati
23 apr 2017 anni
Indicatori delle variazioni dei valori per anni
Minima:
0.0
1 gen 2000 anni
Massimo:
42.446 Mln
1 gen 2008 anni
Alla data di osservazione
Valore
Variazione assoluta
La variazione rispetto al valore precedente
1 gen 1991 anni
840.0 Mille.
+840.0 Mille.
0.0%
1 gen 1997 anni
310.0 Mille.
-530.0 Mille.
-63.1%
1 gen 1998 anni
1.44 Mln
+1.13 Mln
364.52%
1 gen 2000 anni
0.0
-1.44 Mln
-100.0%
1 gen 2002 anni
757.0 Mille.
+757.0 Mille.
%
1 gen 2003 anni
3.442 Mln
+2.685 Mln
354.69%
1 gen 2006 anni
0.0
-3.442 Mln
-100.0%
1 gen 2008 anni
42.446 Mln
+42.446 Mln
%
1 gen 2009 anni
0.0
-42.446 Mln
-100.0%
Classificazione dei paesi secondo i statistiche attuali per anni


Commenti: