29
/
en
AIzaSyAYiBZKx7MnpbEhh9jyipgxe19OcubqV5w
April 1, 2024
252408
St. Vincent and the Grenadines
VCT
true
2
1
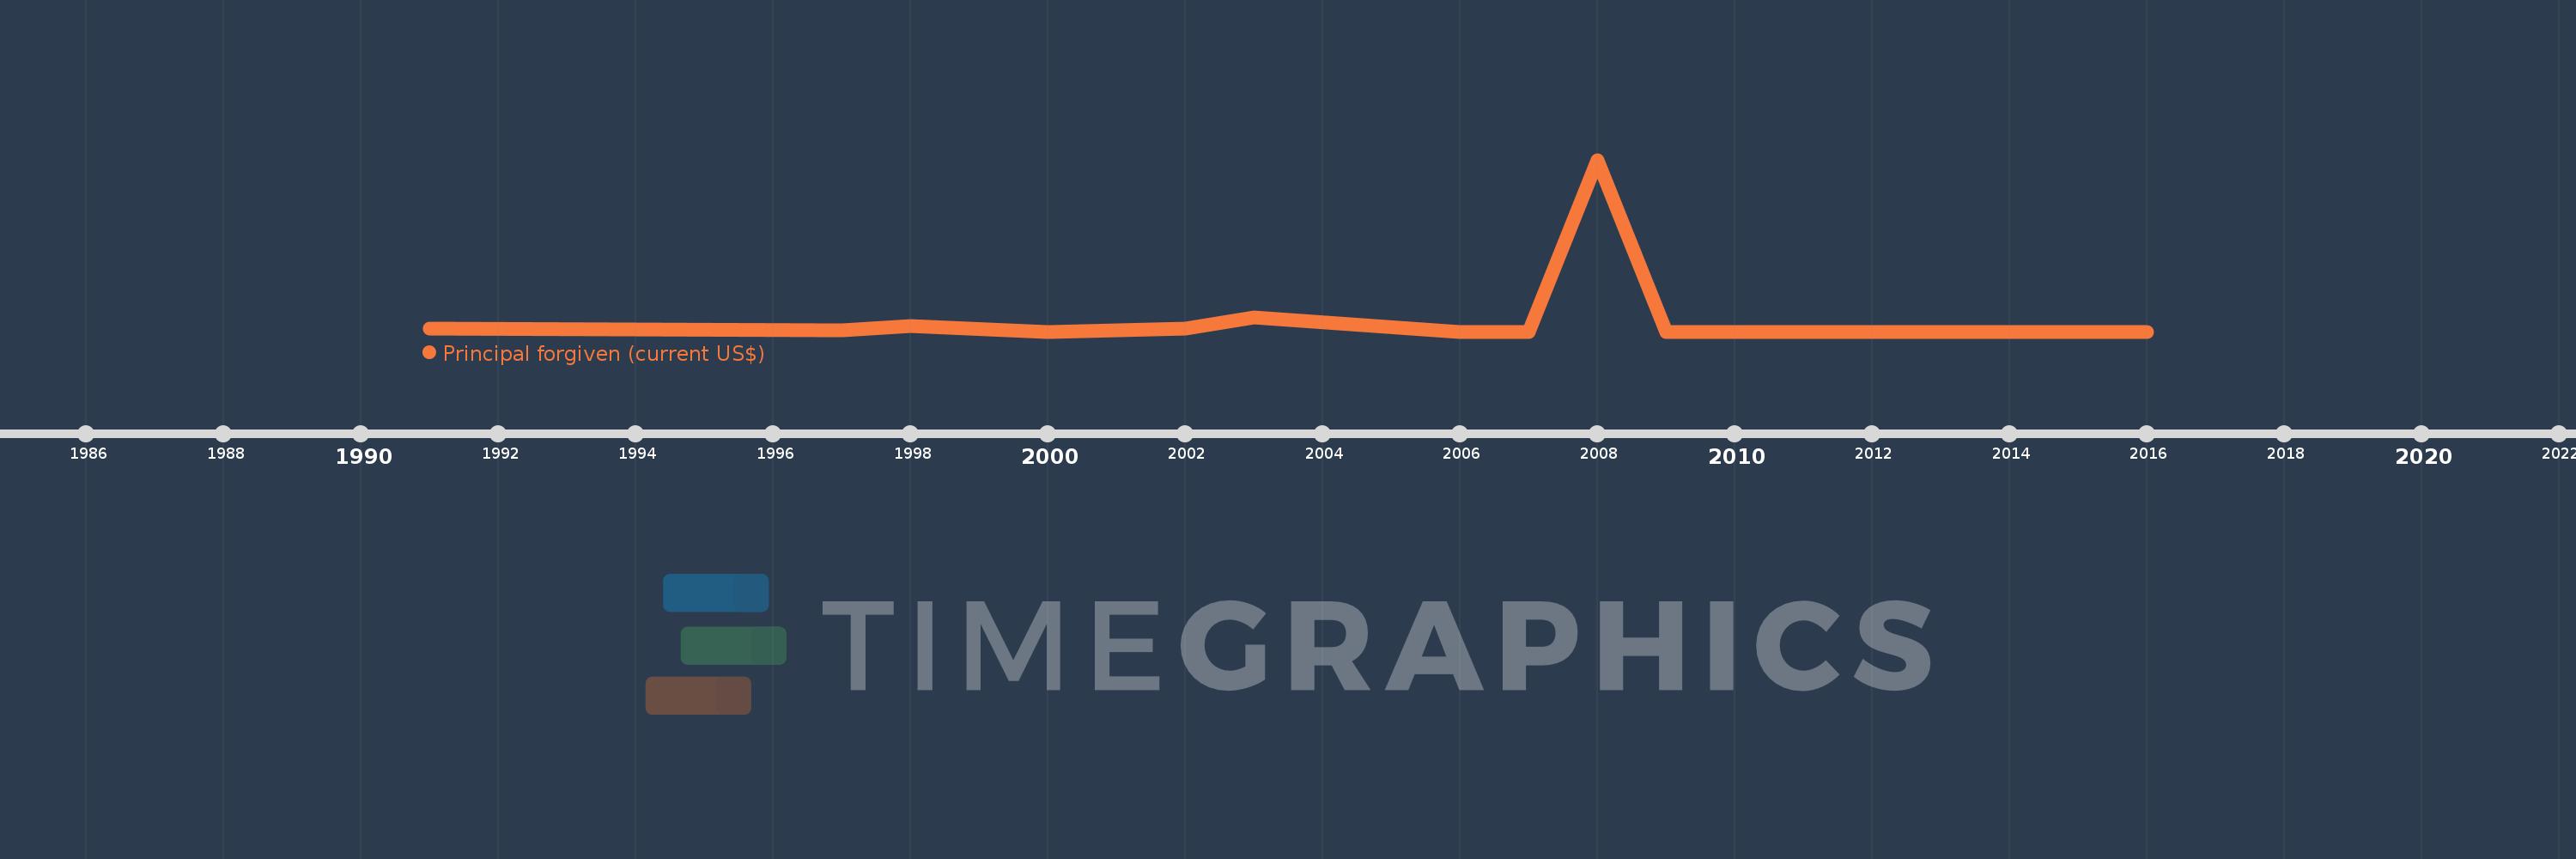
Principal forgiven (current US$)
2016,2015,2014,2013,2012,2011,2010,2009,2008,2007,2006,2003,2002,2000,1998,1997,1991
This statistics in other country:
Timeline:
This timeline shows a graph from 1991 to 2016 of St. Vincent and the Grenadines. No data until 1990. Number of actual observations by date: 17.
Source name:
World Development Indicators
Source organization:
World Bank, International Debt Statistics.
Categories, topics:
External Debt
Last updated:
apr 23, 2017
Indicators value changes by year
Maximum:
42.446 mln
jan 1, 2008
At the date of observation
Value
Absolute change
Change from previous value
jan 1, 1991
840.0K
+840.0K
0.0%
jan 1, 1997
310.0K
-530.0K
-63.1%
jan 1, 1998
1.44 mln
+1.13 mln
364.52%
jan 1, 2000
0.0
-1.44 mln
-100.0%
jan 1, 2002
757.0K
+757.0K
%
jan 1, 2003
3.442 mln
+2.685 mln
354.69%
jan 1, 2006
0.0
-3.442 mln
-100.0%
jan 1, 2008
42.446 mln
+42.446 mln
%
jan 1, 2009
0.0
-42.446 mln
-100.0%
Ranking of countries by current statistics by years


Comments: