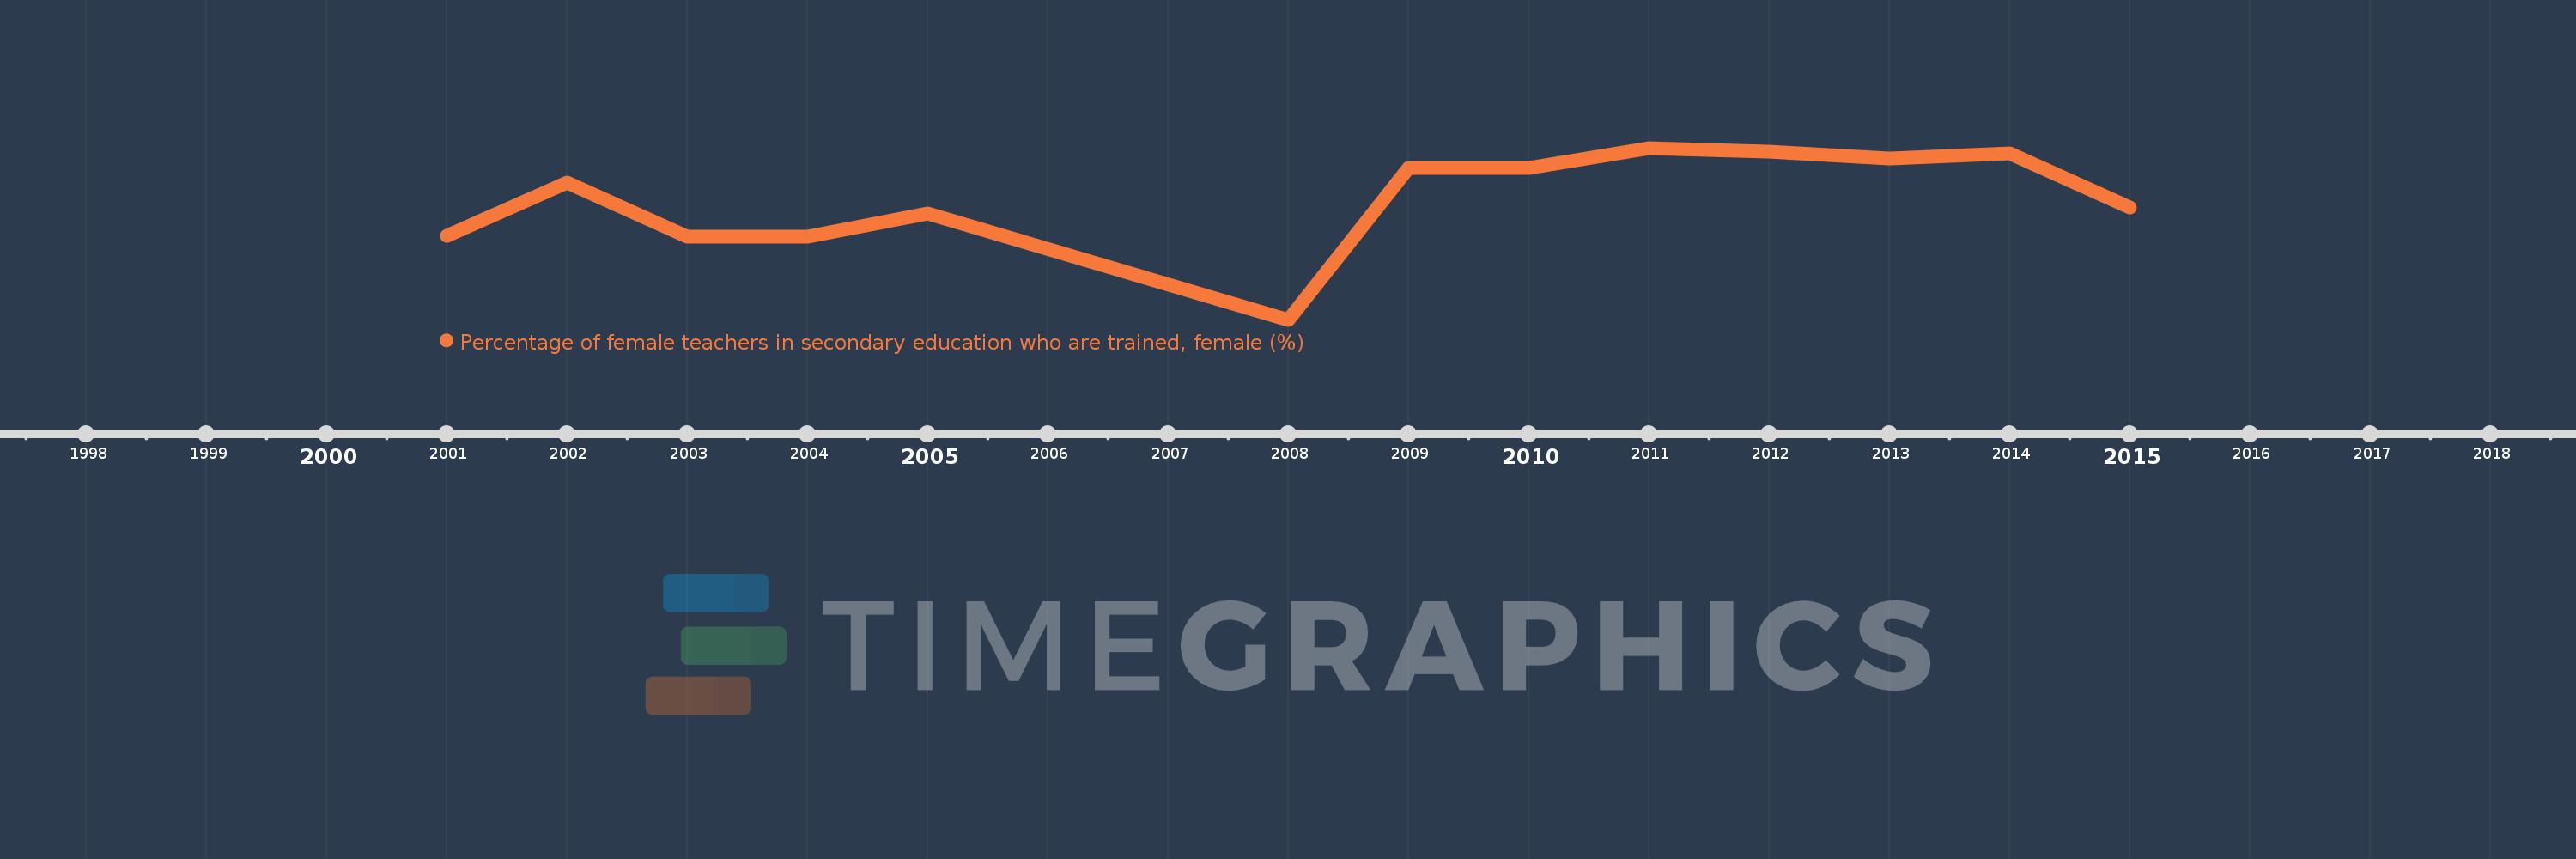
Questa scala temporale mostra un grafico dal 2001 anno al 2015 anno. St. Vincent and the Grenadines. I dati fino ad 2000 anno non disponibili. Il numero di osservazioni attuali secondo i date: 13.
La fonte (nome):
Indicatori dello sviluppo mondiale
La fonte (organizzazione):
UNESCO Institute for Statistics
Categorie:
Education
sono stati aggiornati
23 apr 2017 anni
Indicatori delle variazioni dei valori per anni
In media:
53.512
Minima:
31.429
1 gen 2008 anni
Massimo:
62.7
1 gen 2011 anni
Alla data di osservazione
Valore
Variazione assoluta
La variazione rispetto al valore precedente
1 gen 2001 anni
46.753
+46.753
0.0%
1 gen 2002 anni
56.466
+9.712
20.77%
1 gen 2003 anni
46.614
-9.852
-17.45%
1 gen 2004 anni
46.512
-0.102
-0.22%
1 gen 2005 anni
50.746
+4.235
9.1%
1 gen 2008 anni
31.429
-19.318
-38.07%
1 gen 2009 anni
59.043
+27.614
87.86%
1 gen 2010 anni
59.009
-0.034
-0.06%
1 gen 2011 anni
62.7
+3.691
6.26%
1 gen 2012 anni
61.982
-0.719
-1.15%
1 gen 2013 anni
60.714
-1.267
-2.04%
1 gen 2014 anni
61.758
+1.044
1.72%
1 gen 2015 anni
51.936
-9.822
-15.9%
Classificazione dei paesi secondo i statistiche attuali per anni
