29
/it/
it
AIzaSyAYiBZKx7MnpbEhh9jyipgxe19OcubqV5w
April 1, 2024
251922
St. Vincent and the Grenadines
VCT
true
2
1
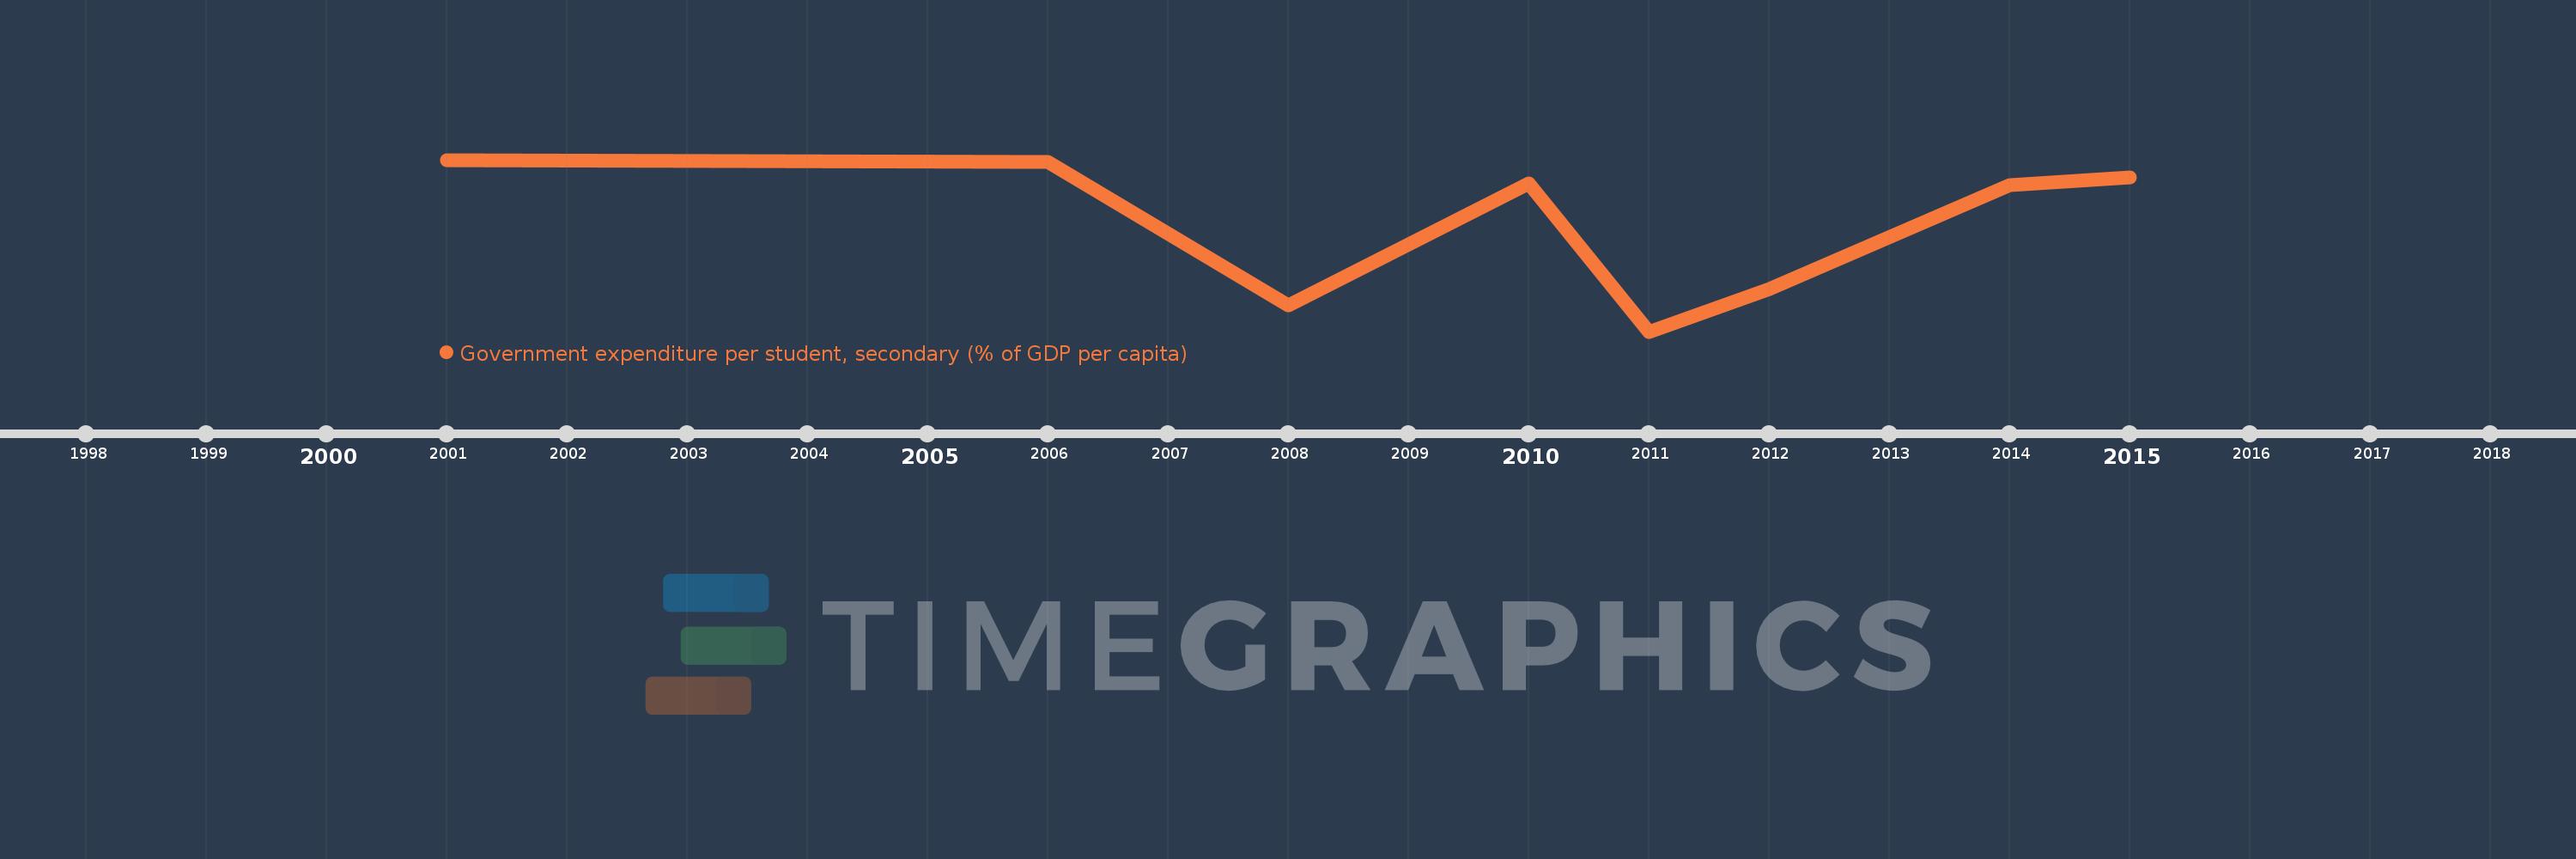
Government expenditure per student, secondary (% of GDP per capita)
2015,2014,2012,2011,2010,2008,2006,2001
Queste statistiche in altri paesi:
Linea del tempo:
Questa scala temporale mostra un grafico dal 2001 anno al 2015 anno. St. Vincent and the Grenadines. I dati fino ad 2000 anno non disponibili. Il numero di osservazioni attuali secondo i date: 8.
La fonte (nome):
Indicatori dello sviluppo mondiale
La fonte (organizzazione):
United Nations Educational, Scientific, and Cultural Organization (UNESCO) Institute for Statistics.
Categorie:
Education
sono stati aggiornati
23 apr 2017 anni
Indicatori delle variazioni dei valori per anni
Minima:
17.645
1 gen 2011 anni
Massimo:
22.474
1 gen 2001 anni
Alla data di osservazione
Valore
Variazione assoluta
La variazione rispetto al valore precedente
1 gen 2001 anni
22.474
+22.474
0.0%
1 gen 2006 anni
22.405
-0.069
-0.31%
1 gen 2008 anni
18.376
-4.029
-17.98%
1 gen 2010 anni
21.821
+3.445
18.75%
1 gen 2011 anni
17.645
-4.176
-19.14%
1 gen 2012 anni
18.837
+1.192
6.76%
1 gen 2014 anni
21.752
+2.915
15.47%
1 gen 2015 anni
21.972
+0.22
1.01%
Classificazione dei paesi secondo i statistiche attuali per anni


Commenti: