29
/de/
de
AIzaSyAYiBZKx7MnpbEhh9jyipgxe19OcubqV5w
April 1, 2024
251922
St. Vincent and the Grenadines
VCT
true
2
1
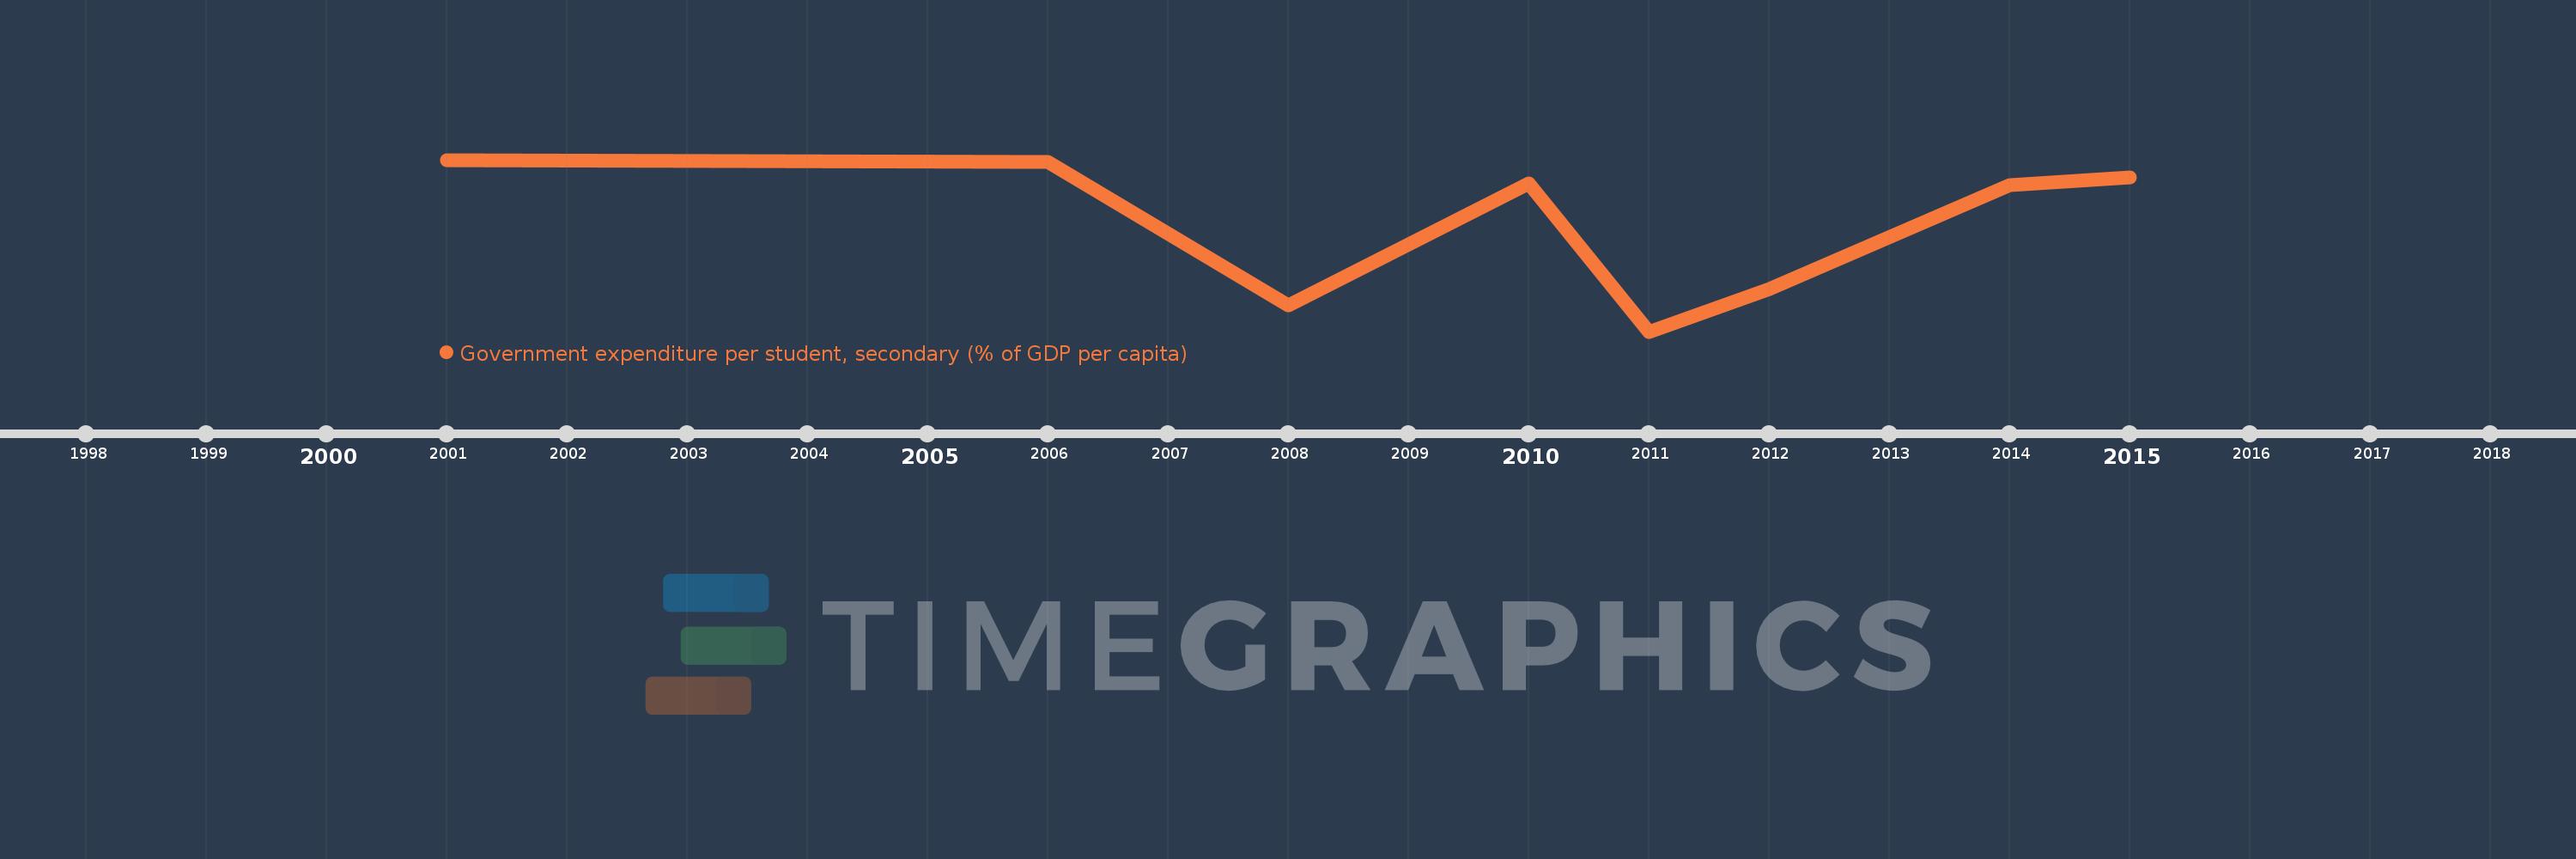
Government expenditure per student, secondary (% of GDP per capita)
2015,2014,2012,2011,2010,2008,2006,2001
Diese Statistik in anderen Ländern:
Zeitlinie:
Diese Zeitleiste vorliegt die Graphik ab 2001 J. bis 2015 J. St. Vincent and the Grenadines. Die Angaben bis 2000 J. sind nicht vorhanden. Die Zahl aktueller Beobachtungen nach Daten: 8.
Die Quelle (Bezeichnung):
Kennzahlen der Weltentwicklung
Die Quelle (Einrichtung):
United Nations Educational, Scientific, and Cultural Organization (UNESCO) Institute for Statistics.
Kategorien:
Education
Es wurde aktualisiert:
23 Apr 2017 Jahr
Kennzahlen der Wertänderungen vom Jahr zum Jahr
Minimum:
17.645
1 Jan 2011 Jahr
Maximum:
22.474
1 Jan 2001 Jahr
Zum Datum der Beobachtung
Wert
Absolute Veränderung
Die Veränderung bezüglich dem vorherigen Wert
1 Jan 2001 Jahr
22.474
+22.474
0.0%
1 Jan 2006 Jahr
22.405
-0.069
-0.31%
1 Jan 2008 Jahr
18.376
-4.029
-17.98%
1 Jan 2010 Jahr
21.821
+3.445
18.75%
1 Jan 2011 Jahr
17.645
-4.176
-19.14%
1 Jan 2012 Jahr
18.837
+1.192
6.76%
1 Jan 2014 Jahr
21.752
+2.915
15.47%
1 Jan 2015 Jahr
21.972
+0.22
1.01%
Bewertung der Länder gemäß mit laufender Statistik nach Jahren


Kommentare: