29
/it/
it
AIzaSyAYiBZKx7MnpbEhh9jyipgxe19OcubqV5w
April 1, 2024
247947
Spain
ESP
true
2
1
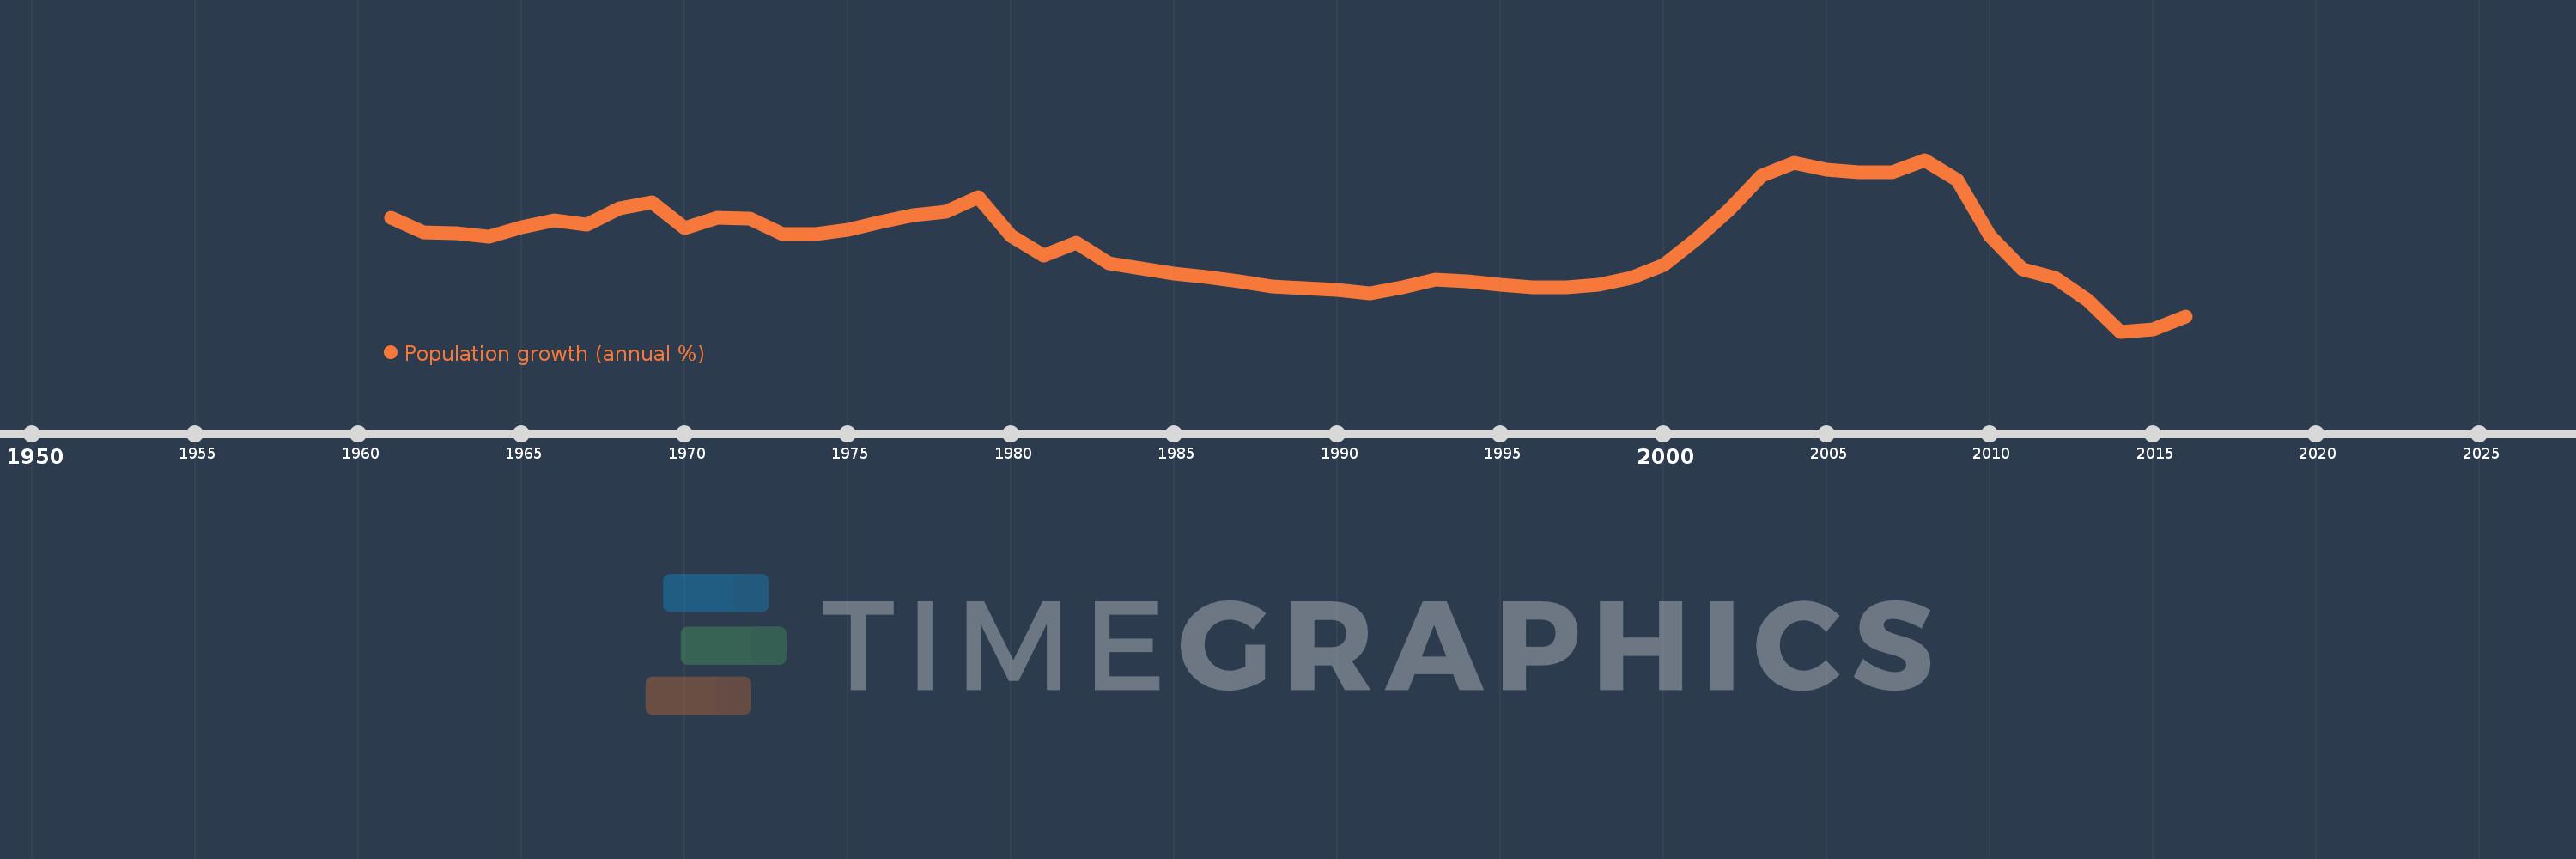
Population growth (annual %)
2016,2015,2014,2013,2012,2011,2010,2009,2008,2007,2006,2005,2004,2003,2002,2001,2000,1999,1998,1997,1996,1995,1994,1993,1992,1991,1990,1989,1988,1987,1986,1985,1984,1983,1982,1981,1980,1979,1978,1977,1976,1975,1974,1973,1972,1971,1970,1969,1968,1967,1966,1965,1964,1963,1962,1961
Queste statistiche in altri paesi:
AfghanistanAlbaniaAlgeriaAmerican SamoaAndorraAngolaAntigua and BarbudaArab WorldArgentinaArmeniaArubaAustraliaAustriaAzerbaijanBahamas, TheBahrainBangladeshBarbadosBelarusBelgiumBelizeBeninBermudaBhutanBoliviaBosnia and HerzegovinaBotswanaBrazilBritish Virgin IslandsBrunei DarussalamBulgariaBurkina FasoBurundiCabo VerdeCambodiaCameroonCanadaCaribbean small statesCayman IslandsCentral African RepublicCentral Europe and the BalticsChadChannel IslandsChileChinaColombiaComorosCongo, Dem. Rep.Congo, Rep.Costa RicaCote d'IvoireCroatiaCubaCuracaoCyprusCzech RepublicDenmarkDjiboutiDominicaDominican RepublicEarly-demographic dividendEast Asia & PacificEast Asia & Pacific (excluding high income)East Asia & Pacific (IDA & IBRD countries)EcuadorEgypt, Arab Rep.El SalvadorEquatorial GuineaEritreaEstoniaEthiopiaEuro areaEurope & Central AsiaEurope & Central Asia (excluding high income)Europe & Central Asia (IDA & IBRD countries)European UnionFaroe IslandsFijiFinlandFragile and conflict affected situationsFranceFrench PolynesiaGabonGambia, TheGeorgiaGermanyGhanaGibraltarGreeceGreenlandGrenadaGuamGuatemalaGuineaGuinea-BissauGuyanaHaitiHeavily indebted poor countries (HIPC)High incomeHondurasHong Kong SAR, ChinaHungaryIBRD onlyIcelandIDA & IBRD totalIDA blendIDA onlyIDA totalIndiaIndonesiaIran, Islamic Rep.IraqIrelandIsle of ManIsraelItalyJamaicaJapanJordanKazakhstanKenyaKiribatiKorea, Dem. People’s Rep.Korea, Rep.KosovoKuwaitKyrgyz RepublicLao PDRLate-demographic dividendLatin America & Caribbean Latin America & Caribbean (excluding high income)Latin America & the Caribbean (IDA & IBRD countries)LatviaLeast developed countries: UN classificationLebanonLesothoLiberiaLibyaLiechtensteinLithuaniaLow & middle incomeLow incomeLower middle incomeLuxembourgMacao SAR, ChinaMacedonia, FYRMadagascarMalawiMalaysiaMaldivesMaliMaltaMarshall IslandsMauritaniaMauritiusMexicoMicronesia, Fed. Sts.Middle East & North AfricaMiddle East & North Africa (excluding high income)Middle East & North Africa (IDA & IBRD countries)Middle incomeMoldovaMonacoMongoliaMontenegroMoroccoMozambiqueMyanmarNamibiaNauruNepalNetherlandsNew CaledoniaNew ZealandNicaraguaNigerNigeriaNorth AmericaNorthern Mariana IslandsNorwayOECD membersOmanOther small statesPacific island small statesPakistanPalauPanamaPapua New GuineaParaguayPeruPhilippinesPolandPortugalPost-demographic dividendPre-demographic dividendPuerto RicoQatarRomaniaRussian FederationRwandaSamoaSan MarinoSao Tome and PrincipeSaudi ArabiaSenegalSerbiaSeychellesSierra LeoneSingaporeSint Maarten (Dutch part)Slovak RepublicSloveniaSmall statesSolomon IslandsSomaliaSouth AfricaSouth AsiaSouth Asia (IDA & IBRD)South SudanSpainSri LankaSt. Kitts and NevisSt. LuciaSt. Martin (French part)St. Vincent and the GrenadinesSub-Saharan Africa Sub-Saharan Africa (excluding high income)Sub-Saharan Africa (IDA & IBRD countries)SudanSurinameSwazilandSwedenSwitzerlandSyrian Arab RepublicTajikistanTanzaniaThailandTimor-LesteTogoTongaTrinidad and TobagoTunisiaTurkeyTurkmenistanTurks and Caicos IslandsTuvaluUgandaUkraineUnited Arab EmiratesUnited KingdomUnited StatesUpper middle incomeUruguayUzbekistanVanuatuVenezuela, RBVietnamVirgin Islands (U.S.)West Bank and GazaWorldYemen, Rep.ZambiaZimbabwe Linea del tempo:
Questa scala temporale mostra un grafico dal 1961 anno al 2016 anno. Spain. I dati fino ad 1960 anno non disponibili. Il numero di osservazioni attuali secondo i date: 56.
La fonte (nome):
Indicatori dello sviluppo mondiale
La fonte (organizzazione):
Derived from total population. Population source: (1) United Nations Population Division. World Population Prospects, (2) United Nations Statistical Division. Population and Vital Statistics Report (various years), (3) Census reports and other statistical
Categorie:
Climate Change, Health
sono stati aggiornati
23 apr 2017 anni
Indicatori delle variazioni dei valori per anni
Minima:
-0.328
1 gen 2014 anni
Massimo:
1.851
1 gen 2008 anni
Alla data di osservazione
Valore
Variazione assoluta
La variazione rispetto al valore precedente
1 gen 1961 anni
1.12
+1.12
0.0%
1 gen 1962 anni
0.929
-0.191
-17.02%
1 gen 1963 anni
0.92
-0.009
-0.97%
1 gen 1964 anni
0.877
-0.043
-4.67%
1 gen 1965 anni
0.994
+0.117
13.3%
1 gen 1966 anni
1.086
+0.092
9.27%
1 gen 1967 anni
1.024
-0.062
-5.69%
1 gen 1968 anni
1.231
+0.207
20.18%
1 gen 1969 anni
1.308
+0.077
6.26%
1 gen 1970 anni
0.985
-0.322
-24.64%
1 gen 1971 anni
1.111
+0.125
12.71%
1 gen 1972 anni
1.109
-0.001
-0.13%
1 gen 1973 anni
0.906
-0.204
-18.36%
1 gen 1974 anni
0.907
+0.001
0.16%
1 gen 1975 anni
0.964
+0.057
6.29%
1 gen 1976 anni
1.065
+0.101
10.47%
1 gen 1977 anni
1.144
+0.079
7.4%
1 gen 1978 anni
1.191
+0.047
4.14%
1 gen 1979 anni
1.372
+0.181
15.2%
1 gen 1980 anni
0.887
-0.485
-35.33%
1 gen 1981 anni
0.637
-0.25
-28.15%
1 gen 1982 anni
0.802
+0.165
25.83%
1 gen 1983 anni
0.534
-0.268
-33.37%
1 gen 1984 anni
0.472
-0.062
-11.63%
1 gen 1985 anni
0.409
-0.064
-13.45%
1 gen 1986 anni
0.366
-0.043
-10.53%
1 gen 1987 anni
0.304
-0.062
-16.99%
1 gen 1988 anni
0.247
-0.057
-18.71%
1 gen 1989 anni
0.22
-0.027
-10.89%
1 gen 1990 anni
0.195
-0.025
-11.25%
1 gen 1991 anni
0.152
-0.043
-22.17%
1 gen 1992 anni
0.228
+0.076
50.0%
1 gen 1993 anni
0.33
+0.102
44.83%
1 gen 1994 anni
0.311
-0.019
-5.77%
1 gen 1995 anni
0.269
-0.042
-13.48%
1 gen 1996 anni
0.234
-0.035
-13.02%
1 gen 1997 anni
0.231
-0.003
-1.19%
1 gen 1998 anni
0.264
+0.032
14.04%
1 gen 1999 anni
0.35
+0.086
32.66%
1 gen 2000 anni
0.515
+0.165
47.28%
1 gen 2001 anni
0.84
+0.325
63.13%
1 gen 2002 anni
1.216
+0.376
44.75%
1 gen 2003 anni
1.644
+0.427
35.14%
1 gen 2004 anni
1.808
+0.164
10.0%
1 gen 2005 anni
1.725
-0.083
-4.59%
1 gen 2006 anni
1.689
-0.036
-2.09%
1 gen 2007 anni
1.69
+0.001
0.06%
1 gen 2008 anni
1.851
+0.161
9.51%
1 gen 2009 anni
1.595
-0.256
-13.82%
1 gen 2010 anni
0.886
-0.71
-44.48%
1 gen 2011 anni
0.46
-0.425
-48.02%
1 gen 2012 anni
0.355
-0.105
-22.82%
1 gen 2013 anni
0.065
-0.29
-81.73%
1 gen 2014 anni
-0.328
-0.393
-604.68%
1 gen 2015 anni
-0.299
+0.029
-8.76%
1 gen 2016 anni
-0.135
+0.164
-54.91%
Classificazione dei paesi secondo i statistiche attuali per anni


Commenti: