29
/it/
it
AIzaSyAYiBZKx7MnpbEhh9jyipgxe19OcubqV5w
April 1, 2024
190718
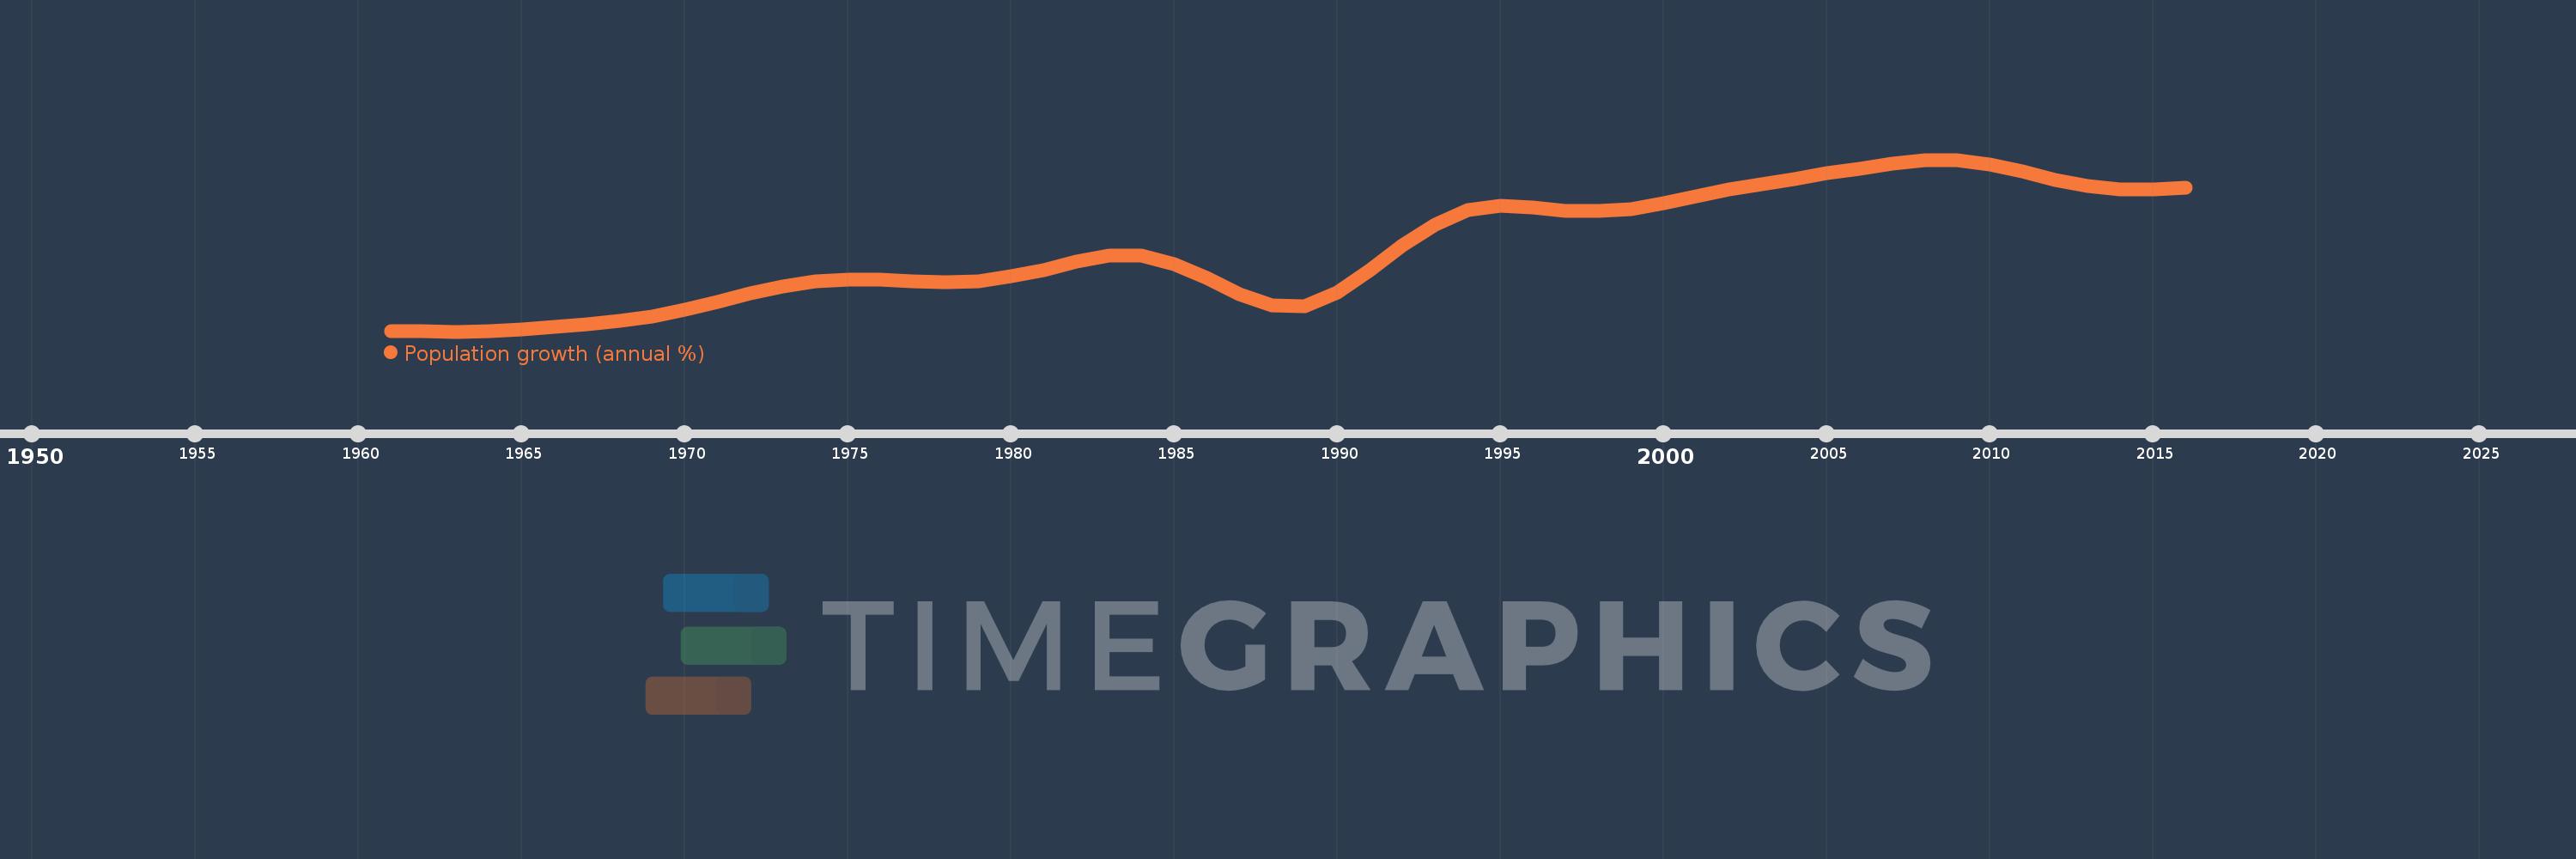
Mali
MLI
true
2
1
Population growth (annual %)
2016,2015,2014,2013,2012,2011,2010,2009,2008,2007,2006,2005,2004,2003,2002,2001,2000,1999,1998,1997,1996,1995,1994,1993,1992,1991,1990,1989,1988,1987,1986,1985,1984,1983,1982,1981,1980,1979,1978,1977,1976,1975,1974,1973,1972,1971,1970,1969,1968,1967,1966,1965,1964,1963,1962,1961
Queste statistiche in altri paesi:
AfghanistanAlbaniaAlgeriaAmerican SamoaAndorraAngolaAntigua and BarbudaArab WorldArgentinaArmeniaArubaAustraliaAustriaAzerbaijanBahamas, TheBahrainBangladeshBarbadosBelarusBelgiumBelizeBeninBermudaBhutanBoliviaBosnia and HerzegovinaBotswanaBrazilBritish Virgin IslandsBrunei DarussalamBulgariaBurkina FasoBurundiCabo VerdeCambodiaCameroonCanadaCaribbean small statesCayman IslandsCentral African RepublicCentral Europe and the BalticsChadChannel IslandsChileChinaColombiaComorosCongo, Dem. Rep.Congo, Rep.Costa RicaCote d'IvoireCroatiaCubaCuracaoCyprusCzech RepublicDenmarkDjiboutiDominicaDominican RepublicEarly-demographic dividendEast Asia & PacificEast Asia & Pacific (excluding high income)East Asia & Pacific (IDA & IBRD countries)EcuadorEgypt, Arab Rep.El SalvadorEquatorial GuineaEritreaEstoniaEthiopiaEuro areaEurope & Central AsiaEurope & Central Asia (excluding high income)Europe & Central Asia (IDA & IBRD countries)European UnionFaroe IslandsFijiFinlandFragile and conflict affected situationsFranceFrench PolynesiaGabonGambia, TheGeorgiaGermanyGhanaGibraltarGreeceGreenlandGrenadaGuamGuatemalaGuineaGuinea-BissauGuyanaHaitiHeavily indebted poor countries (HIPC)High incomeHondurasHong Kong SAR, ChinaHungaryIBRD onlyIcelandIDA & IBRD totalIDA blendIDA onlyIDA totalIndiaIndonesiaIran, Islamic Rep.IraqIrelandIsle of ManIsraelItalyJamaicaJapanJordanKazakhstanKenyaKiribatiKorea, Dem. People’s Rep.Korea, Rep.KosovoKuwaitKyrgyz RepublicLao PDRLate-demographic dividendLatin America & Caribbean Latin America & Caribbean (excluding high income)Latin America & the Caribbean (IDA & IBRD countries)LatviaLeast developed countries: UN classificationLebanonLesothoLiberiaLibyaLiechtensteinLithuaniaLow & middle incomeLow incomeLower middle incomeLuxembourgMacao SAR, ChinaMacedonia, FYRMadagascarMalawiMalaysiaMaldivesMaliMaltaMarshall IslandsMauritaniaMauritiusMexicoMicronesia, Fed. Sts.Middle East & North AfricaMiddle East & North Africa (excluding high income)Middle East & North Africa (IDA & IBRD countries)Middle incomeMoldovaMonacoMongoliaMontenegroMoroccoMozambiqueMyanmarNamibiaNauruNepalNetherlandsNew CaledoniaNew ZealandNicaraguaNigerNigeriaNorth AmericaNorthern Mariana IslandsNorwayOECD membersOmanOther small statesPacific island small statesPakistanPalauPanamaPapua New GuineaParaguayPeruPhilippinesPolandPortugalPost-demographic dividendPre-demographic dividendPuerto RicoQatarRomaniaRussian FederationRwandaSamoaSan MarinoSao Tome and PrincipeSaudi ArabiaSenegalSerbiaSeychellesSierra LeoneSingaporeSint Maarten (Dutch part)Slovak RepublicSloveniaSmall statesSolomon IslandsSomaliaSouth AfricaSouth AsiaSouth Asia (IDA & IBRD)South SudanSpainSri LankaSt. Kitts and NevisSt. LuciaSt. Martin (French part)St. Vincent and the GrenadinesSub-Saharan Africa Sub-Saharan Africa (excluding high income)Sub-Saharan Africa (IDA & IBRD countries)SudanSurinameSwazilandSwedenSwitzerlandSyrian Arab RepublicTajikistanTanzaniaThailandTimor-LesteTogoTongaTrinidad and TobagoTunisiaTurkeyTurkmenistanTurks and Caicos IslandsTuvaluUgandaUkraineUnited Arab EmiratesUnited KingdomUnited StatesUpper middle incomeUruguayUzbekistanVanuatuVenezuela, RBVietnamVirgin Islands (U.S.)West Bank and GazaWorldYemen, Rep.ZambiaZimbabwe Linea del tempo:
Questa scala temporale mostra un grafico dal 1961 anno al 2016 anno. Mali. I dati fino ad 1960 anno non disponibili. Il numero di osservazioni attuali secondo i date: 56.
La fonte (nome):
Indicatori dello sviluppo mondiale
La fonte (organizzazione):
Derived from total population. Population source: (1) United Nations Population Division. World Population Prospects, (2) United Nations Statistical Division. Population and Vital Statistics Report (various years), (3) Census reports and other statistical
Categorie:
Climate Change, Health
sono stati aggiornati
23 apr 2017 anni
Indicatori delle variazioni dei valori per anni
Minima:
1.104
1 gen 1963 anni
Massimo:
3.32
1 gen 2008 anni
Alla data di osservazione
Valore
Variazione assoluta
La variazione rispetto al valore precedente
1 gen 1961 anni
1.113
+1.113
0.0%
1 gen 1962 anni
1.106
-0.007
-0.67%
1 gen 1963 anni
1.104
-0.002
-0.14%
1 gen 1964 anni
1.113
+0.009
0.8%
1 gen 1965 anni
1.135
+0.022
1.99%
1 gen 1966 anni
1.169
+0.034
2.99%
1 gen 1967 anni
1.203
+0.033
2.85%
1 gen 1968 anni
1.24
+0.038
3.13%
1 gen 1969 anni
1.3
+0.059
4.77%
1 gen 1970 anni
1.384
+0.085
6.52%
1 gen 1971 anni
1.484
+0.1
7.21%
1 gen 1972 anni
1.592
+0.108
7.3%
1 gen 1973 anni
1.688
+0.096
6.04%
1 gen 1974 anni
1.753
+0.065
3.84%
1 gen 1975 anni
1.777
+0.024
1.35%
1 gen 1976 anni
1.773
-0.004
-0.21%
1 gen 1977 anni
1.752
-0.022
-1.22%
1 gen 1978 anni
1.739
-0.012
-0.71%
1 gen 1979 anni
1.757
+0.018
1.03%
1 gen 1980 anni
1.817
+0.06
3.4%
1 gen 1981 anni
1.899
+0.082
4.51%
1 gen 1982 anni
2.007
+0.109
5.72%
1 gen 1983 anni
2.09
+0.083
4.13%
1 gen 1984 anni
2.086
-0.004
-0.2%
1 gen 1985 anni
1.971
-0.115
-5.5%
1 gen 1986 anni
1.795
-0.176
-8.93%
1 gen 1987 anni
1.59
-0.206
-11.45%
1 gen 1988 anni
1.445
-0.145
-9.13%
1 gen 1989 anni
1.436
-0.008
-0.56%
1 gen 1990 anni
1.608
+0.171
11.93%
1 gen 1991 anni
1.897
+0.289
17.96%
1 gen 1992 anni
2.221
+0.325
17.12%
1 gen 1993 anni
2.489
+0.268
12.06%
1 gen 1994 anni
2.667
+0.178
7.15%
1 gen 1995 anni
2.724
+0.057
2.14%
1 gen 1996 anni
2.702
-0.022
-0.79%
1 gen 1997 anni
2.665
-0.037
-1.37%
1 gen 1998 anni
2.661
-0.005
-0.18%
1 gen 1999 anni
2.686
+0.026
0.96%
1 gen 2000 anni
2.755
+0.069
2.55%
1 gen 2001 anni
2.85
+0.095
3.46%
1 gen 2002 anni
2.936
+0.086
3.03%
1 gen 2003 anni
3.004
+0.068
2.31%
1 gen 2004 anni
3.073
+0.069
2.3%
1 gen 2005 anni
3.143
+0.07
2.28%
1 gen 2006 anni
3.207
+0.064
2.03%
1 gen 2007 anni
3.273
+0.066
2.06%
1 gen 2008 anni
3.32
+0.047
1.44%
1 gen 2009 anni
3.318
-0.002
-0.06%
1 gen 2010 anni
3.259
-0.059
-1.78%
1 gen 2011 anni
3.166
-0.093
-2.84%
1 gen 2012 anni
3.063
-0.103
-3.25%
1 gen 2013 anni
2.981
-0.082
-2.69%
1 gen 2014 anni
2.934
-0.047
-1.57%
1 gen 2015 anni
2.933
-0.001
-0.02%
1 gen 2016 anni
2.962
+0.029
0.98%
Classificazione dei paesi secondo i statistiche attuali per anni


Commenti: