29
/it/
it
AIzaSyAYiBZKx7MnpbEhh9jyipgxe19OcubqV5w
April 1, 2024
246412
South Africa
ZAF
true
2
1
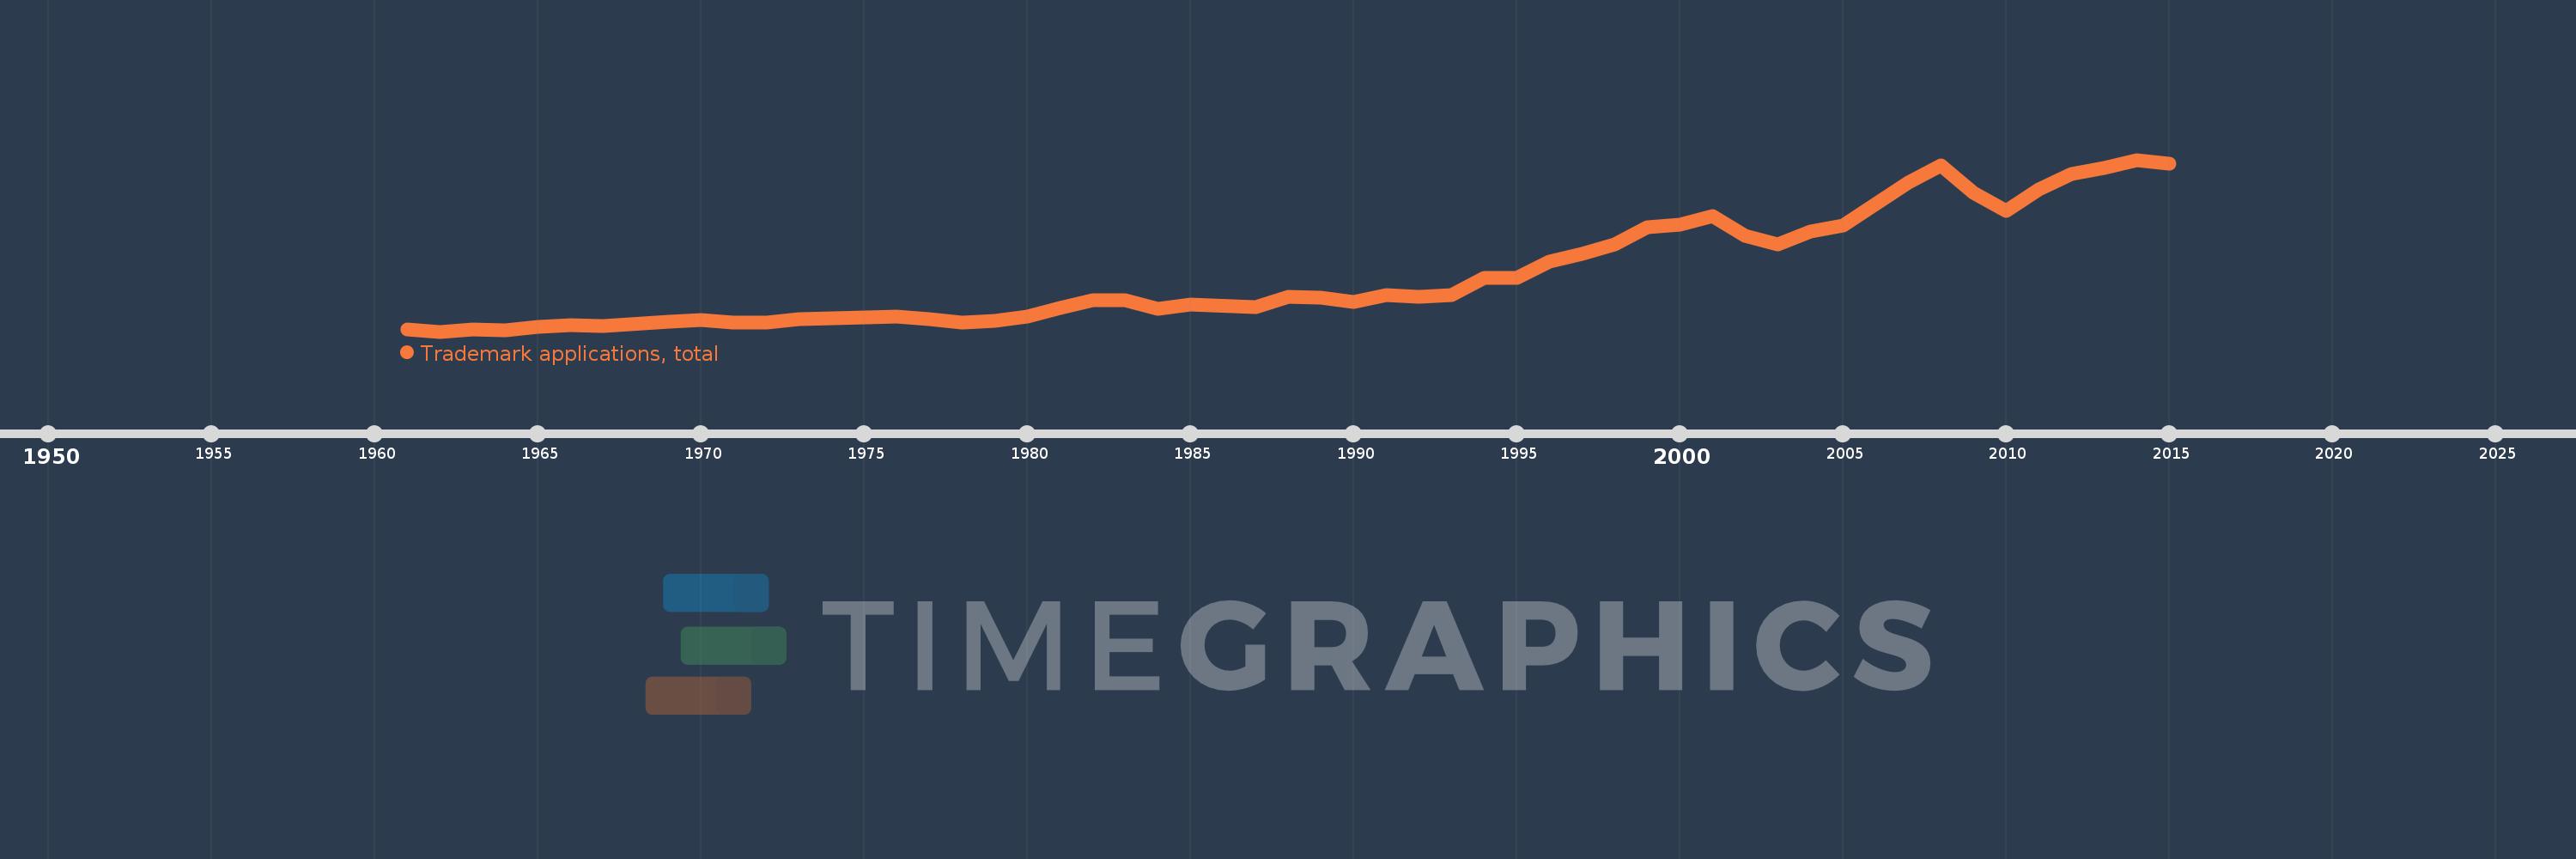
Trademark applications, total
2015,2014,2013,2012,2011,2010,2009,2008,2007,2006,2005,2004,2003,2002,2001,2000,1999,1998,1997,1996,1995,1994,1993,1992,1991,1990,1989,1988,1987,1985,1984,1983,1982,1981,1980,1979,1978,1977,1976,1975,1974,1973,1972,1971,1970,1969,1967,1966,1965,1964,1963,1962,1961
Queste statistiche in altri paesi:
AlbaniaAlgeriaAndorraAngolaAntigua and BarbudaArab WorldArgentinaArmeniaArubaAustraliaAustriaAzerbaijanBahamas, TheBahrainBangladeshBarbadosBelarusBelgiumBelizeBhutanBoliviaBosnia and HerzegovinaBotswanaBrazilBrunei DarussalamBulgariaBurkina FasoBurundiCabo VerdeCambodiaCanadaCaribbean small statesCentral Europe and the BalticsChileChinaColombiaComorosCongo, Dem. Rep.Costa RicaCroatiaCubaCuracaoCyprusCzech RepublicDenmarkDjiboutiDominicaDominican RepublicEarly-demographic dividendEast Asia & PacificEast Asia & Pacific (excluding high income)East Asia & Pacific (IDA & IBRD countries)EcuadorEgypt, Arab Rep.El SalvadorEquatorial GuineaEstoniaEthiopiaEuro areaEurope & Central AsiaEurope & Central Asia (excluding high income)Europe & Central Asia (IDA & IBRD countries)European UnionFijiFinlandFranceGambia, TheGeorgiaGermanyGhanaGreeceGrenadaGuatemalaGuineaGuinea-BissauGuyanaHaitiHigh incomeHondurasHong Kong SAR, ChinaHungaryIBRD onlyIcelandIDA & IBRD totalIDA blendIDA onlyIDA totalIndiaIndonesiaIran, Islamic Rep.IraqIrelandIsraelItalyJamaicaJapanJordanKazakhstanKenyaKiribatiKorea, Dem. People’s Rep.Korea, Rep.KuwaitKyrgyz RepublicLao PDRLate-demographic dividendLatin America & Caribbean Latin America & Caribbean (excluding high income)Latin America & the Caribbean (IDA & IBRD countries)LatviaLeast developed countries: UN classificationLebanonLesothoLiberiaLibyaLiechtensteinLithuaniaLow & middle incomeLower middle incomeLuxembourgMacao SAR, ChinaMacedonia, FYRMadagascarMalawiMalaysiaMaldivesMaliMaltaMauritiusMexicoMiddle East & North AfricaMiddle East & North Africa (excluding high income)Middle East & North Africa (IDA & IBRD countries)Middle incomeMoldovaMonacoMongoliaMontenegroMoroccoMozambiqueMyanmarNamibiaNepalNetherlandsNew ZealandNicaraguaNigeriaNorth AmericaNorwayOECD membersOmanOther small statesPacific island small statesPakistanPanamaPapua New GuineaParaguayPeruPhilippinesPolandPortugalPost-demographic dividendQatarRomaniaRussian FederationRwandaSamoaSan MarinoSao Tome and PrincipeSaudi ArabiaSerbiaSeychellesSierra LeoneSingaporeSint Maarten (Dutch part)Slovak RepublicSloveniaSmall statesSolomon IslandsSomaliaSouth AfricaSouth AsiaSouth Asia (IDA & IBRD)SpainSri LankaSt. LuciaSt. Vincent and the GrenadinesSudanSurinameSwazilandSwedenSwitzerlandSyrian Arab RepublicTajikistanTanzaniaThailandTongaTrinidad and TobagoTunisiaTurkeyTurkmenistanTuvaluUgandaUkraineUnited Arab EmiratesUnited KingdomUnited StatesUpper middle incomeUruguayUzbekistanVenezuela, RBVietnamWorldYemen, Rep.ZambiaZimbabwe Linea del tempo:
Questa scala temporale mostra un grafico dal 1961 anno al 2015 anno. South Africa. I dati fino ad 1960 anno non disponibili. Il numero di osservazioni attuali secondo i date: 53.
La fonte (nome):
Indicatori dello sviluppo mondiale
La fonte (organizzazione):
World Intellectual Property Organization (WIPO), World Intellectual Property Indicators and www.wipo.int/econ_stat. The International Bureau of WIPO assumes no responsibility with respect to the transformation of these data.
Categorie:
Science & Technology
sono stati aggiornati
23 apr 2017 anni
Indicatori delle variazioni dei valori per anni
Minima:
4.126 Mille.
1 gen 1962 anni
Massimo:
36.07 Mille.
1 gen 2014 anni
Alla data di osservazione
Valore
Variazione assoluta
La variazione rispetto al valore precedente
1 gen 1961 anni
4.546 Mille.
+4.546 Mille.
0.0%
1 gen 1962 anni
4.126 Mille.
-420.0
-9.24%
1 gen 1963 anni
4.538 Mille.
+412.0
9.99%
1 gen 1964 anni
4.437 Mille.
-101.0
-2.23%
1 gen 1965 anni
4.943 Mille.
+506.0
11.4%
1 gen 1966 anni
5.354 Mille.
+411.0
8.31%
1 gen 1967 anni
5.203 Mille.
-151.0
-2.82%
1 gen 1969 anni
5.956 Mille.
+753.0
14.47%
1 gen 1970 anni
6.28 Mille.
+324.0
5.44%
1 gen 1971 anni
5.856 Mille.
-424.0
-6.75%
1 gen 1972 anni
5.876 Mille.
+20.0
0.34%
1 gen 1973 anni
6.424 Mille.
+548.0
9.33%
1 gen 1974 anni
6.653 Mille.
+229.0
3.56%
1 gen 1975 anni
6.688 Mille.
+35.0
0.53%
1 gen 1976 anni
6.964 Mille.
+276.0
4.13%
1 gen 1977 anni
6.429 Mille.
-535.0
-7.68%
1 gen 1978 anni
5.756 Mille.
-673.0
-10.47%
1 gen 1979 anni
6.202 Mille.
+446.0
7.75%
1 gen 1980 anni
6.942 Mille.
+740.0
11.93%
1 gen 1981 anni
8.582 Mille.
+1.64 Mille.
23.62%
1 gen 1982 anni
9.891 Mille.
+1.309 Mille.
15.25%
1 gen 1983 anni
10.008 Mille.
+117.0
1.18%
1 gen 1984 anni
8.29 Mille.
-1.718 Mille.
-17.17%
1 gen 1985 anni
9.206 Mille.
+916.0
11.05%
1 gen 1987 anni
8.659 Mille.
-547.0
-5.94%
1 gen 1988 anni
10.583 Mille.
+1.924 Mille.
22.22%
1 gen 1989 anni
10.457 Mille.
-126.0
-1.19%
1 gen 1990 anni
9.661 Mille.
-796.0
-7.61%
1 gen 1991 anni
10.873 Mille.
+1.212 Mille.
12.55%
1 gen 1992 anni
10.6 Mille.
-273.0
-2.51%
1 gen 1993 anni
10.991 Mille.
+391.0
3.69%
1 gen 1994 anni
14.179 Mille.
+3.188 Mille.
29.01%
1 gen 1995 anni
14.063 Mille.
-116.0
-0.82%
1 gen 1996 anni
17.087 Mille.
+3.024 Mille.
21.5%
1 gen 1997 anni
18.504 Mille.
+1.417 Mille.
8.29%
1 gen 1998 anni
20.336 Mille.
+1.832 Mille.
9.9%
1 gen 1999 anni
23.6 Mille.
+3.264 Mille.
16.05%
1 gen 2000 anni
23.938 Mille.
+338.0
1.43%
1 gen 2001 anni
25.678 Mille.
+1.74 Mille.
7.27%
1 gen 2002 anni
21.901 Mille.
-3.777 Mille.
-14.71%
1 gen 2003 anni
20.367 Mille.
-1.534 Mille.
-7.0%
1 gen 2004 anni
22.768 Mille.
+2.401 Mille.
11.79%
1 gen 2005 anni
23.826 Mille.
+1.058 Mille.
4.65%
1 gen 2006 anni
27.835 Mille.
+4.009 Mille.
16.83%
1 gen 2007 anni
31.795 Mille.
+3.96 Mille.
14.23%
1 gen 2008 anni
35.001 Mille.
+3.206 Mille.
10.08%
1 gen 2009 anni
29.907 Mille.
-5.094 Mille.
-14.55%
1 gen 2010 anni
26.621 Mille.
-3.286 Mille.
-10.99%
1 gen 2011 anni
30.549 Mille.
+3.928 Mille.
14.76%
1 gen 2012 anni
33.484 Mille.
+2.935 Mille.
9.61%
1 gen 2013 anni
34.604 Mille.
+1.12 Mille.
3.34%
1 gen 2014 anni
36.07 Mille.
+1.466 Mille.
4.24%
1 gen 2015 anni
35.418 Mille.
-652.0
-1.81%
Classificazione dei paesi secondo i statistiche attuali per anni


Commenti: