29
/it/
it
AIzaSyAYiBZKx7MnpbEhh9jyipgxe19OcubqV5w
April 1, 2024
155443
India
IND
true
2
1
Trademark applications, total
2015,2014,2013,2012,2011,2010,2009,2008,2007,2006,2005,2004,2003,2002,2001,2000,1999,1998,1997,1996,1995,1994,1993,1992,1991,1990,1989,1988,1987,1986,1985,1984,1983,1982,1980,1979,1978,1977,1976,1975,1974,1973,1972,1971,1970,1969,1968,1967,1966,1965,1964
Queste statistiche in altri paesi:
AlbaniaAlgeriaAndorraAngolaAntigua and BarbudaArab WorldArgentinaArmeniaArubaAustraliaAustriaAzerbaijanBahamas, TheBahrainBangladeshBarbadosBelarusBelgiumBelizeBhutanBoliviaBosnia and HerzegovinaBotswanaBrazilBrunei DarussalamBulgariaBurkina FasoBurundiCabo VerdeCambodiaCanadaCaribbean small statesCentral Europe and the BalticsChileChinaColombiaComorosCongo, Dem. Rep.Costa RicaCroatiaCubaCuracaoCyprusCzech RepublicDenmarkDjiboutiDominicaDominican RepublicEarly-demographic dividendEast Asia & PacificEast Asia & Pacific (excluding high income)East Asia & Pacific (IDA & IBRD countries)EcuadorEgypt, Arab Rep.El SalvadorEquatorial GuineaEstoniaEthiopiaEuro areaEurope & Central AsiaEurope & Central Asia (excluding high income)Europe & Central Asia (IDA & IBRD countries)European UnionFijiFinlandFranceGambia, TheGeorgiaGermanyGhanaGreeceGrenadaGuatemalaGuineaGuinea-BissauGuyanaHaitiHigh incomeHondurasHong Kong SAR, ChinaHungaryIBRD onlyIcelandIDA & IBRD totalIDA blendIDA onlyIDA totalIndiaIndonesiaIran, Islamic Rep.IraqIrelandIsraelItalyJamaicaJapanJordanKazakhstanKenyaKiribatiKorea, Dem. People’s Rep.Korea, Rep.KuwaitKyrgyz RepublicLao PDRLate-demographic dividendLatin America & Caribbean Latin America & Caribbean (excluding high income)Latin America & the Caribbean (IDA & IBRD countries)LatviaLeast developed countries: UN classificationLebanonLesothoLiberiaLibyaLiechtensteinLithuaniaLow & middle incomeLower middle incomeLuxembourgMacao SAR, ChinaMacedonia, FYRMadagascarMalawiMalaysiaMaldivesMaliMaltaMauritiusMexicoMiddle East & North AfricaMiddle East & North Africa (excluding high income)Middle East & North Africa (IDA & IBRD countries)Middle incomeMoldovaMonacoMongoliaMontenegroMoroccoMozambiqueMyanmarNamibiaNepalNetherlandsNew ZealandNicaraguaNigeriaNorth AmericaNorwayOECD membersOmanOther small statesPacific island small statesPakistanPanamaPapua New GuineaParaguayPeruPhilippinesPolandPortugalPost-demographic dividendQatarRomaniaRussian FederationRwandaSamoaSan MarinoSao Tome and PrincipeSaudi ArabiaSerbiaSeychellesSierra LeoneSingaporeSint Maarten (Dutch part)Slovak RepublicSloveniaSmall statesSolomon IslandsSomaliaSouth AfricaSouth AsiaSouth Asia (IDA & IBRD)SpainSri LankaSt. LuciaSt. Vincent and the GrenadinesSudanSurinameSwazilandSwedenSwitzerlandSyrian Arab RepublicTajikistanTanzaniaThailandTongaTrinidad and TobagoTunisiaTurkeyTurkmenistanTuvaluUgandaUkraineUnited Arab EmiratesUnited KingdomUnited StatesUpper middle incomeUruguayUzbekistanVenezuela, RBVietnamWorldYemen, Rep.ZambiaZimbabwe Linea del tempo:
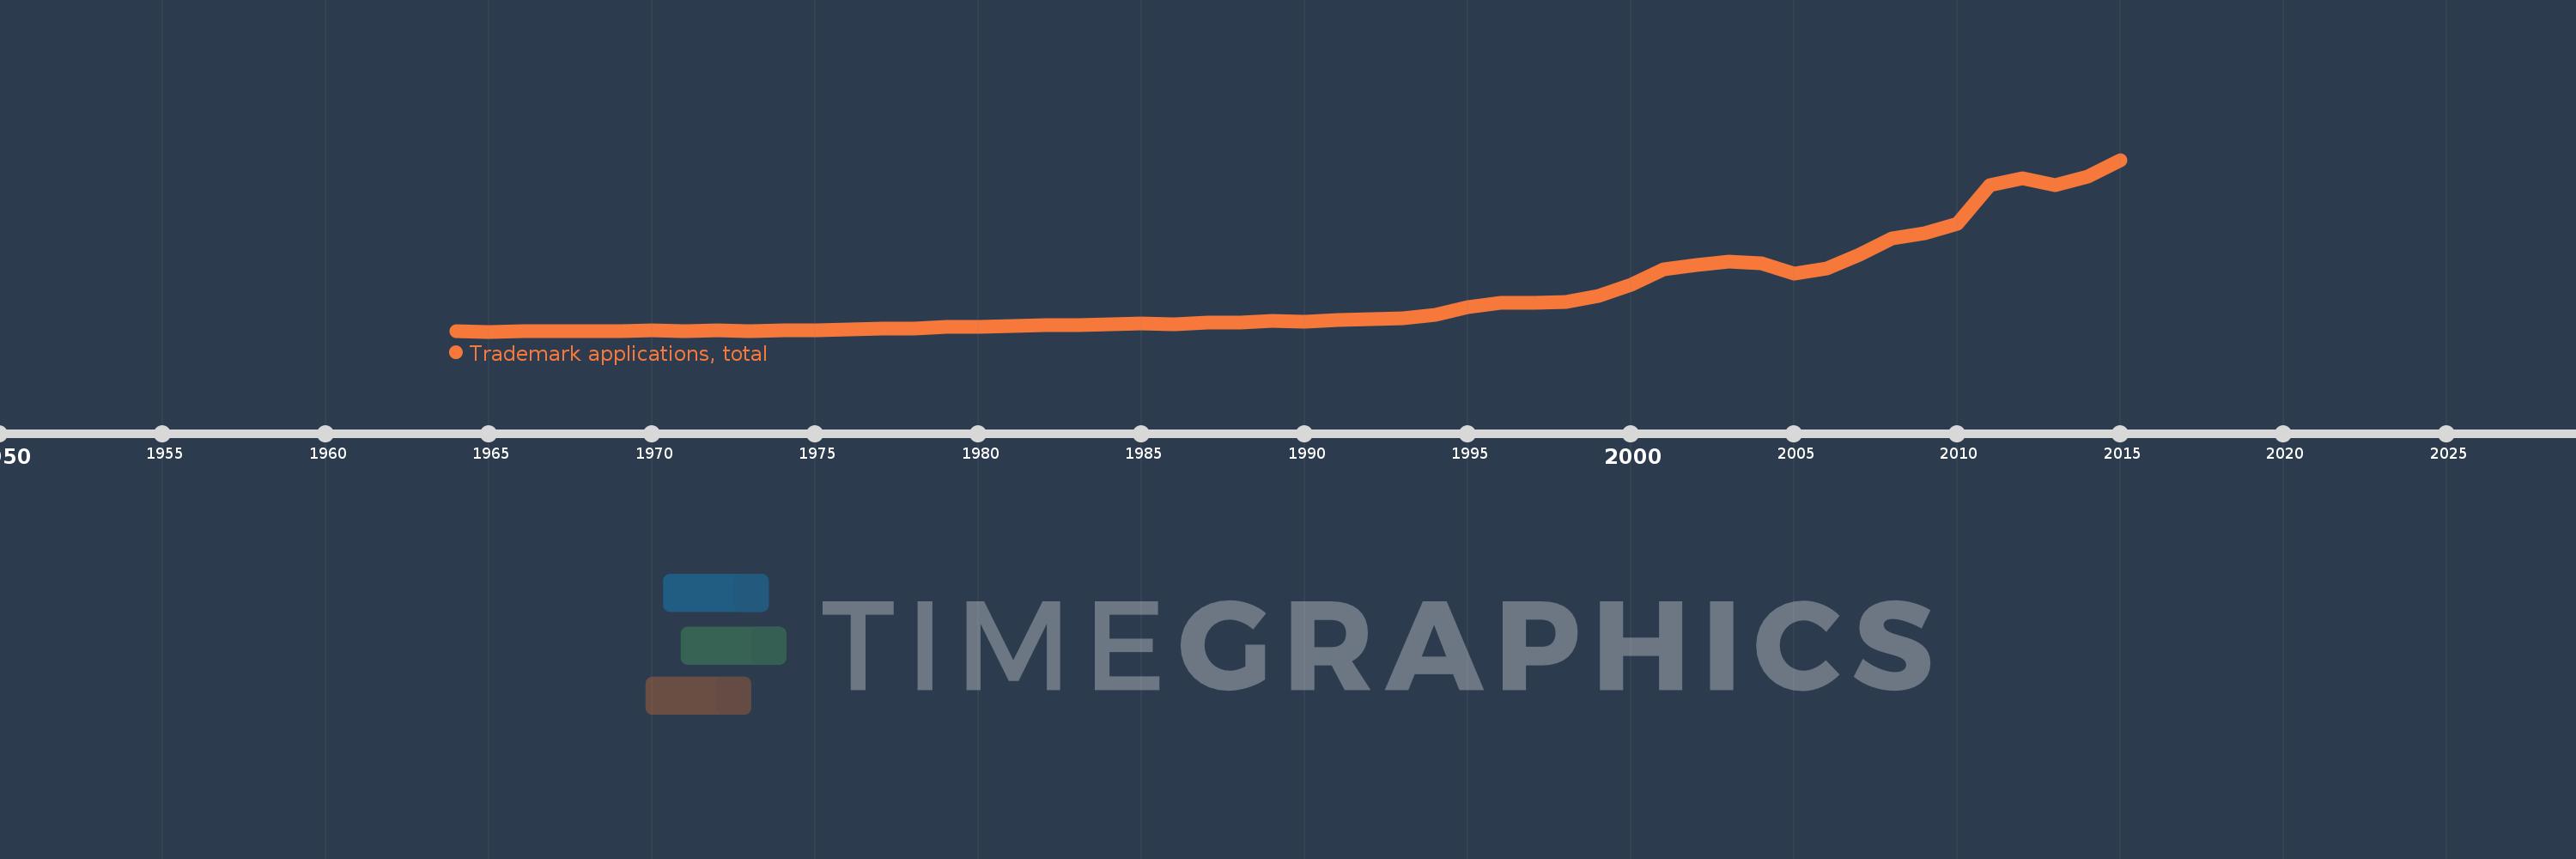
Questa scala temporale mostra un grafico dal 1964 anno al 2015 anno. India. I dati fino ad 1963 anno non disponibili. Il numero di osservazioni attuali secondo i date: 51.
La fonte (nome):
Indicatori dello sviluppo mondiale
La fonte (organizzazione):
World Intellectual Property Organization (WIPO), World Intellectual Property Indicators and www.wipo.int/econ_stat. The International Bureau of WIPO assumes no responsibility with respect to the transformation of these data.
Categorie:
Science & Technology
sono stati aggiornati
23 apr 2017 anni
Indicatori delle variazioni dei valori per anni
Minima:
6.594 Mille.
1 gen 1965 anni
Massimo:
222.235 Mille.
1 gen 2015 anni
Alla data di osservazione
Valore
Variazione assoluta
La variazione rispetto al valore precedente
1 gen 1964 anni
6.707 Mille.
+6.707 Mille.
0.0%
1 gen 1965 anni
6.594 Mille.
-113.0
-1.68%
1 gen 1966 anni
6.654 Mille.
+60.0
0.91%
1 gen 1967 anni
6.767 Mille.
+113.0
1.7%
1 gen 1968 anni
6.611 Mille.
-156.0
-2.31%
1 gen 1969 anni
7.466 Mille.
+855.0
12.93%
1 gen 1970 anni
7.847 Mille.
+381.0
5.1%
1 gen 1971 anni
7.4 Mille.
-447.0
-5.7%
1 gen 1972 anni
8.423 Mille.
+1.023 Mille.
13.82%
1 gen 1973 anni
7.593 Mille.
-830.0
-9.85%
1 gen 1974 anni
8.141 Mille.
+548.0
7.22%
1 gen 1975 anni
8.595 Mille.
+454.0
5.58%
1 gen 1976 anni
9.423 Mille.
+828.0
9.63%
1 gen 1977 anni
10.466 Mille.
+1.043 Mille.
11.07%
1 gen 1978 anni
10.401 Mille.
-65.0
-0.62%
1 gen 1979 anni
12.201 Mille.
+1.8 Mille.
17.31%
1 gen 1980 anni
12.668 Mille.
+467.0
3.83%
1 gen 1982 anni
14.397 Mille.
+1.729 Mille.
13.65%
1 gen 1983 anni
14.691 Mille.
+294.0
2.04%
1 gen 1984 anni
15.87 Mille.
+1.179 Mille.
8.03%
1 gen 1985 anni
16.306 Mille.
+436.0
2.75%
1 gen 1986 anni
15.914 Mille.
-392.0
-2.4%
1 gen 1987 anni
17.81 Mille.
+1.896 Mille.
11.91%
1 gen 1988 anni
18.227 Mille.
+417.0
2.34%
1 gen 1989 anni
19.582 Mille.
+1.355 Mille.
7.43%
1 gen 1990 anni
18.846 Mille.
-736.0
-3.76%
1 gen 1991 anni
20.681 Mille.
+1.835 Mille.
9.74%
1 gen 1992 anni
21.994 Mille.
+1.313 Mille.
6.35%
1 gen 1993 anni
22.982 Mille.
+988.0
4.49%
1 gen 1994 anni
27.485 Mille.
+4.503 Mille.
19.59%
1 gen 1995 anni
37.097 Mille.
+9.612 Mille.
34.97%
1 gen 1996 anni
42.723 Mille.
+5.626 Mille.
15.17%
1 gen 1997 anni
43.234 Mille.
+511.0
1.2%
1 gen 1998 anni
43.302 Mille.
+68.0
0.16%
1 gen 1999 anni
51.704 Mille.
+8.402 Mille.
19.4%
1 gen 2000 anni
65.73 Mille.
+14.026 Mille.
27.13%
1 gen 2001 anni
84.275 Mille.
+18.545 Mille.
28.21%
1 gen 2002 anni
90.236 Mille.
+5.961 Mille.
7.07%
1 gen 2003 anni
94.12 Mille.
+3.884 Mille.
4.3%
1 gen 2004 anni
92.251 Mille.
-1.869 Mille.
-1.99%
1 gen 2005 anni
78.996 Mille.
-13.255 Mille.
-14.37%
1 gen 2006 anni
85.669 Mille.
+6.673 Mille.
8.45%
1 gen 2007 anni
103.419 Mille.
+17.75 Mille.
20.72%
1 gen 2008 anni
123.514 Mille.
+20.095 Mille.
19.43%
1 gen 2009 anni
130.172 Mille.
+6.658 Mille.
5.39%
1 gen 2010 anni
141.943 Mille.
+11.771 Mille.
9.04%
1 gen 2011 anni
189.925 Mille.
+47.982 Mille.
33.8%
1 gen 2012 anni
198.547 Mille.
+8.622 Mille.
4.54%
1 gen 2013 anni
190.85 Mille.
-7.697 Mille.
-3.88%
1 gen 2014 anni
200.769 Mille.
+9.919 Mille.
5.2%
1 gen 2015 anni
222.235 Mille.
+21.466 Mille.
10.69%
Classificazione dei paesi secondo i statistiche attuali per anni


Commenti: