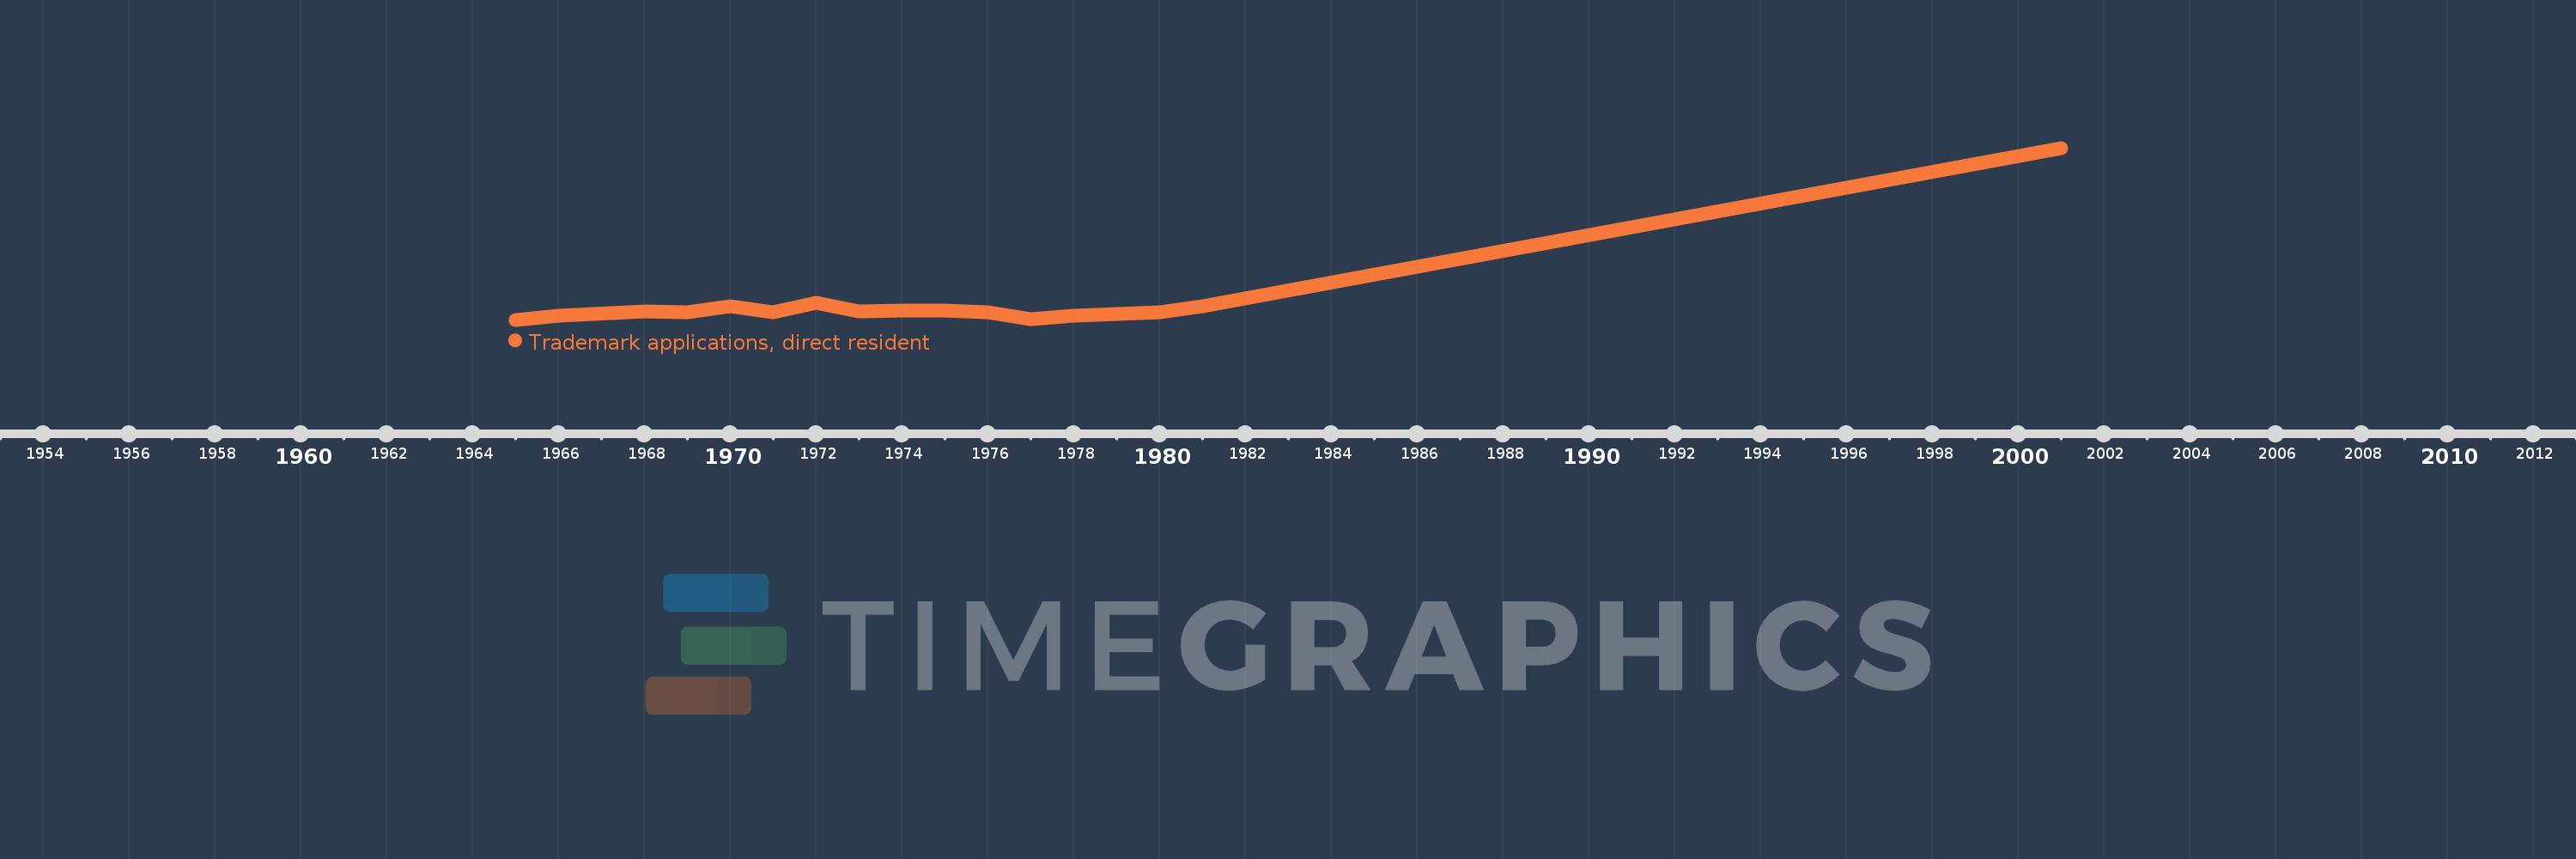
Questa scala temporale mostra un grafico dal 1965 anno al 2001 anno. Arab World. I dati fino ad 1964 anno non disponibili. Il numero di osservazioni attuali secondo i date: 17.
La fonte (nome):
Indicatori dello sviluppo mondiale
La fonte (organizzazione):
World Intellectual Property Organization (WIPO), WIPO Patent Report: Statistics on Worldwide Patent Activity. The International Bureau of WIPO assumes no responsibility with respect to the transformation of these data.
Categorie:
Science & Technology
sono stati aggiornati
23 apr 2017 anni
Indicatori delle variazioni dei valori per anni
In media:
2.74 Mille.
Minima:
1.377 Mille.
1 gen 1965 anni
Massimo:
14.834 Mille.
1 gen 2001 anni
Alla data di osservazione
Valore
Variazione assoluta
La variazione rispetto al valore precedente
1 gen 1965 anni
1.377 Mille.
+1.377 Mille.
0.0%
1 gen 1966 anni
1.675 Mille.
+298.0
21.64%
1 gen 1968 anni
2.048 Mille.
+373.0
22.27%
1 gen 1969 anni
1.978 Mille.
-70.0
-3.42%
1 gen 1970 anni
2.4 Mille.
+422.0
21.33%
1 gen 1971 anni
1.996 Mille.
-404.0
-16.83%
1 gen 1972 anni
2.713 Mille.
+717.0
35.92%
1 gen 1973 anni
2.034 Mille.
-679.0
-25.03%
1 gen 1974 anni
2.118 Mille.
+84.0
4.13%
1 gen 1975 anni
2.075 Mille.
-43.0
-2.03%
1 gen 1976 anni
1.953 Mille.
-122.0
-5.88%
1 gen 1977 anni
1.421 Mille.
-532.0
-27.24%
1 gen 1978 anni
1.662 Mille.
+241.0
16.96%
1 gen 1979 anni
1.839 Mille.
+177.0
10.65%
1 gen 1980 anni
1.996 Mille.
+157.0
8.54%
1 gen 1981 anni
2.463 Mille.
+467.0
23.4%
1 gen 2001 anni
14.834 Mille.
+12.371 Mille.
502.27%
Classificazione dei paesi secondo i statistiche attuali per anni
