29
/it/
it
AIzaSyAYiBZKx7MnpbEhh9jyipgxe19OcubqV5w
April 1, 2024
192000
Malta
MLT
true
2
1
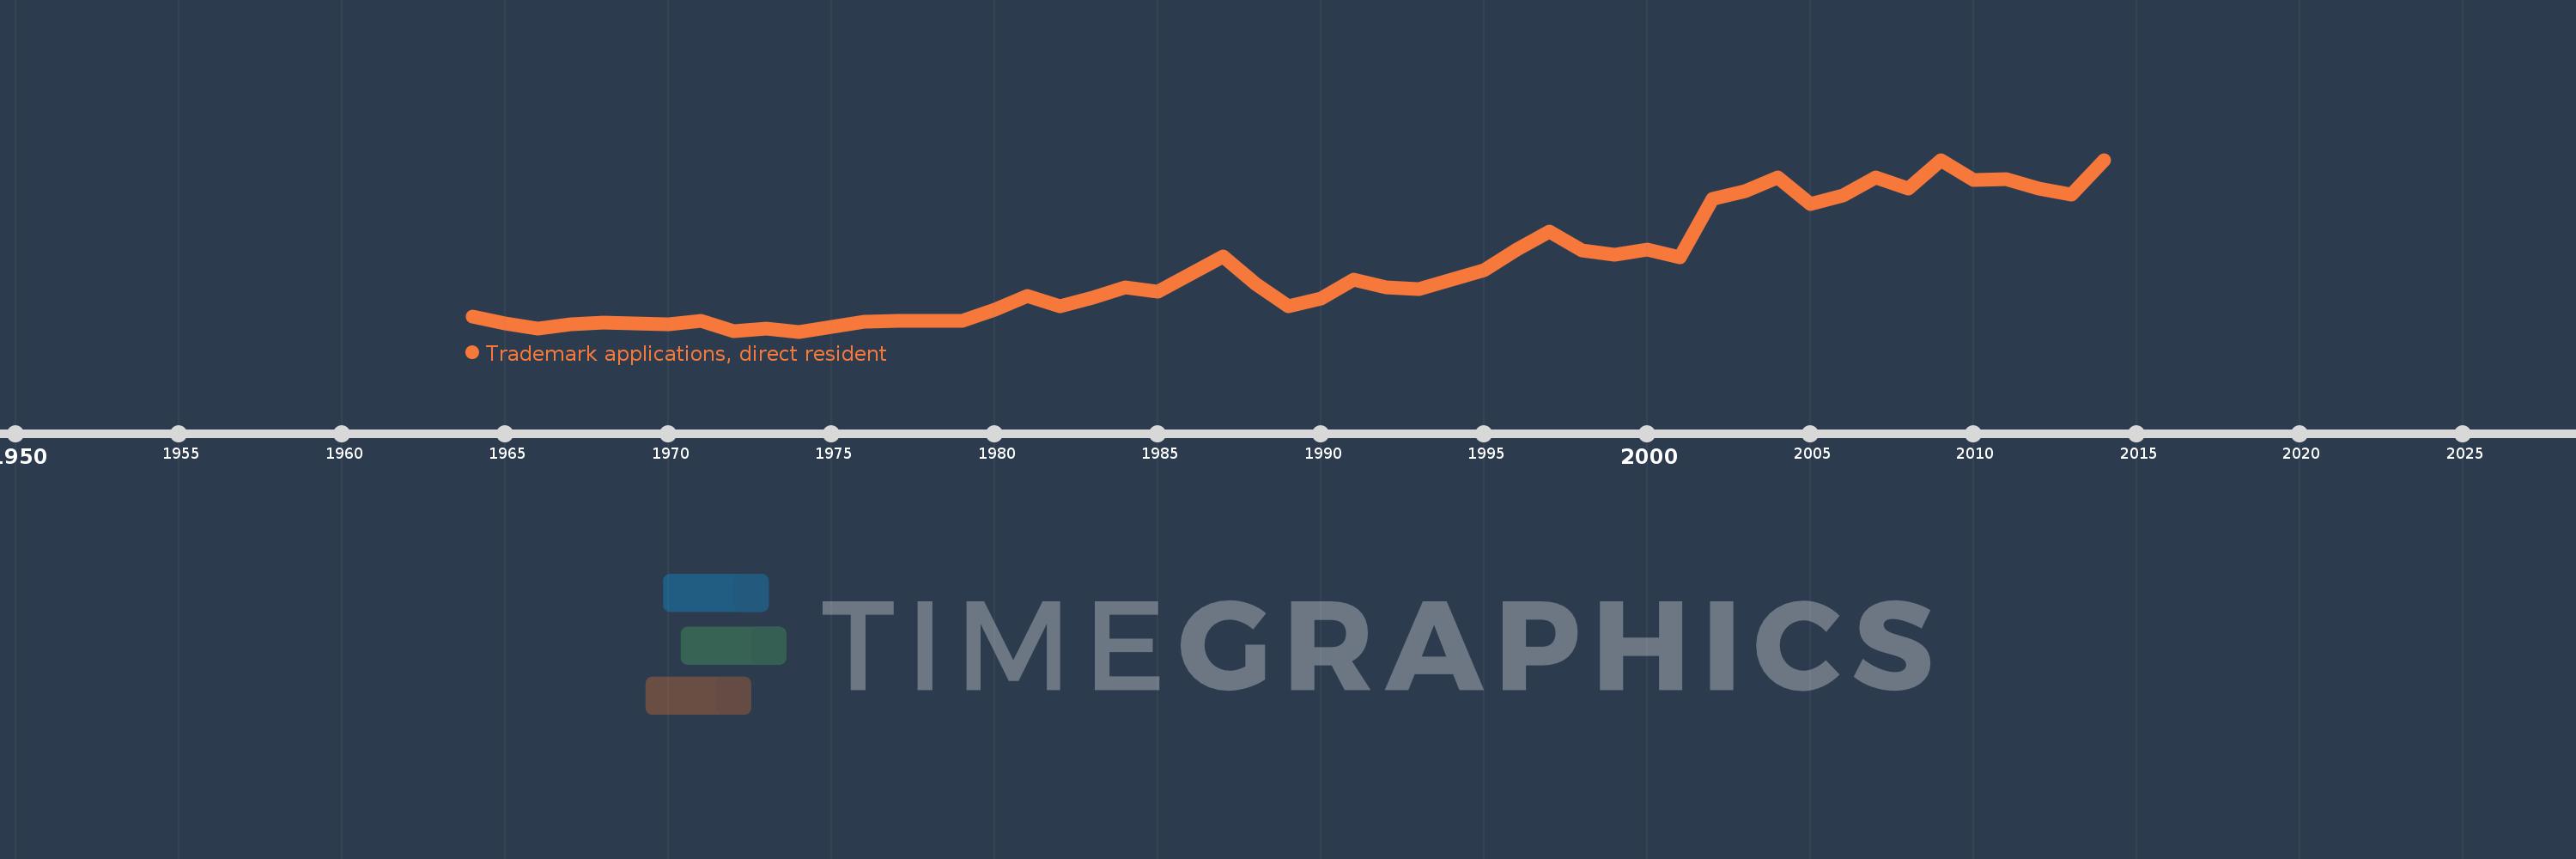
Trademark applications, direct resident
2014,2013,2012,2011,2010,2009,2008,2007,2006,2005,2004,2003,2002,2001,2000,1999,1998,1997,1996,1995,1994,1993,1992,1991,1990,1989,1988,1987,1985,1984,1983,1982,1981,1980,1979,1978,1977,1976,1975,1974,1973,1972,1971,1970,1968,1967,1966,1965,1964
Queste statistiche in altri paesi:
AlbaniaAlgeriaAndorraAngolaArab WorldArgentinaArmeniaArubaAustraliaAustriaAzerbaijanBahamas, TheBahrainBangladeshBarbadosBelarusBelgiumBelizeBhutanBoliviaBosnia and HerzegovinaBotswanaBrazilBrunei DarussalamBulgariaBurkina FasoBurundiCabo VerdeCambodiaCanadaCaribbean small statesCentral Europe and the BalticsChileChinaColombiaCongo, Dem. Rep.Costa RicaCroatiaCubaCuracaoCyprusCzech RepublicDenmarkDjiboutiDominicaDominican RepublicEarly-demographic dividendEast Asia & PacificEast Asia & Pacific (excluding high income)East Asia & Pacific (IDA & IBRD countries)EcuadorEgypt, Arab Rep.El SalvadorEstoniaEthiopiaEuro areaEurope & Central AsiaEurope & Central Asia (excluding high income)Europe & Central Asia (IDA & IBRD countries)European UnionFijiFinlandFranceGambia, TheGeorgiaGermanyGhanaGreeceGrenadaGuatemalaGuineaGuinea-BissauGuyanaHaitiHigh incomeHondurasHong Kong SAR, ChinaHungaryIBRD onlyIcelandIDA & IBRD totalIDA blendIndiaIndonesiaIran, Islamic Rep.IraqIrelandIsraelItalyJamaicaJapanJordanKazakhstanKenyaKorea, Dem. People’s Rep.Korea, Rep.KuwaitKyrgyz RepublicLao PDRLate-demographic dividendLatin America & Caribbean Latin America & Caribbean (excluding high income)Latin America & the Caribbean (IDA & IBRD countries)LatviaLebanonLesothoLiberiaLibyaLiechtensteinLithuaniaLow & middle incomeLower middle incomeLuxembourgMacao SAR, ChinaMacedonia, FYRMadagascarMalawiMalaysiaMaldivesMaliMaltaMauritiusMexicoMiddle East & North AfricaMiddle East & North Africa (excluding high income)Middle East & North Africa (IDA & IBRD countries)Middle incomeMoldovaMonacoMongoliaMontenegroMoroccoMozambiqueMyanmarNamibiaNepalNetherlandsNew ZealandNicaraguaNigeriaNorth AmericaNorwayOECD membersOmanPakistanPanamaPapua New GuineaParaguayPeruPhilippinesPolandPortugalPost-demographic dividendQatarRomaniaRussian FederationRwandaSamoaSan MarinoSao Tome and PrincipeSaudi ArabiaSerbiaSeychellesSierra LeoneSingaporeSlovak RepublicSloveniaSomaliaSouth AfricaSouth AsiaSouth Asia (IDA & IBRD)SpainSri LankaSt. LuciaSt. Vincent and the GrenadinesSudanSurinameSwazilandSwedenSwitzerlandSyrian Arab RepublicTajikistanTanzaniaThailandTongaTrinidad and TobagoTunisiaTurkeyTurkmenistanUgandaUkraineUnited Arab EmiratesUnited KingdomUnited StatesUpper middle incomeUruguayUzbekistanVenezuela, RBVietnamWorldYemen, Rep.ZambiaZimbabwe Linea del tempo:
Questa scala temporale mostra un grafico dal 1964 anno al 2014 anno. Malta. I dati fino ad 1963 anno non disponibili. Il numero di osservazioni attuali secondo i date: 49.
La fonte (nome):
Indicatori dello sviluppo mondiale
La fonte (organizzazione):
World Intellectual Property Organization (WIPO), WIPO Patent Report: Statistics on Worldwide Patent Activity. The International Bureau of WIPO assumes no responsibility with respect to the transformation of these data.
Categorie:
Science & Technology
sono stati aggiornati
23 apr 2017 anni
Indicatori delle variazioni dei valori per anni
Minima:
24.0
1 gen 1974 anni
Massimo:
503.0
1 gen 2009 anni
Alla data di osservazione
Valore
Variazione assoluta
La variazione rispetto al valore precedente
1 gen 1964 anni
65.0
+65.0
0.0%
1 gen 1965 anni
47.0
-18.0
-27.69%
1 gen 1966 anni
33.0
-14.0
-29.79%
1 gen 1967 anni
44.0
+11.0
33.33%
1 gen 1968 anni
49.0
+5.0
11.36%
1 gen 1970 anni
44.0
-5.0
-10.2%
1 gen 1971 anni
53.0
+9.0
20.45%
1 gen 1972 anni
25.0
-28.0
-52.83%
1 gen 1973 anni
32.0
+7.0
28.0%
1 gen 1974 anni
24.0
-8.0
-25.0%
1 gen 1975 anni
37.0
+13.0
54.17%
1 gen 1976 anni
52.0
+15.0
40.54%
1 gen 1977 anni
54.0
+2.0
3.85%
1 gen 1978 anni
54.0
0.0
0.0%
1 gen 1979 anni
54.0
0.0
0.0%
1 gen 1980 anni
84.0
+30.0
55.56%
1 gen 1981 anni
123.0
+39.0
46.43%
1 gen 1982 anni
94.0
-29.0
-23.58%
1 gen 1983 anni
118.0
+24.0
25.53%
1 gen 1984 anni
148.0
+30.0
25.42%
1 gen 1985 anni
135.0
-13.0
-8.78%
1 gen 1987 anni
233.0
+98.0
72.59%
1 gen 1988 anni
156.0
-77.0
-33.05%
1 gen 1989 anni
94.0
-62.0
-39.74%
1 gen 1990 anni
116.0
+22.0
23.4%
1 gen 1991 anni
169.0
+53.0
45.69%
1 gen 1992 anni
148.0
-21.0
-12.43%
1 gen 1993 anni
142.0
-6.0
-4.05%
1 gen 1994 anni
168.0
+26.0
18.31%
1 gen 1995 anni
195.0
+27.0
16.07%
1 gen 1996 anni
252.0
+57.0
29.23%
1 gen 1997 anni
303.0
+51.0
20.24%
1 gen 1998 anni
250.0
-53.0
-17.49%
1 gen 1999 anni
239.0
-11.0
-4.4%
1 gen 2000 anni
253.0
+14.0
5.86%
1 gen 2001 anni
232.0
-21.0
-8.3%
1 gen 2002 anni
393.0
+161.0
69.4%
1 gen 2003 anni
416.0
+23.0
5.85%
1 gen 2004 anni
454.0
+38.0
9.13%
1 gen 2005 anni
379.0
-75.0
-16.52%
1 gen 2006 anni
403.0
+24.0
6.33%
1 gen 2007 anni
454.0
+51.0
12.66%
1 gen 2008 anni
422.0
-32.0
-7.05%
1 gen 2009 anni
503.0
+81.0
19.19%
1 gen 2010 anni
446.0
-57.0
-11.33%
1 gen 2011 anni
450.0
+4.0
0.9%
1 gen 2012 anni
423.0
-27.0
-6.0%
1 gen 2013 anni
405.0
-18.0
-4.26%
1 gen 2014 anni
503.0
+98.0
24.2%
Classificazione dei paesi secondo i statistiche attuali per anni


Commenti: