29
/it/
it
AIzaSyAYiBZKx7MnpbEhh9jyipgxe19OcubqV5w
April 1, 2024
240165
Singapore
SGP
true
2
1
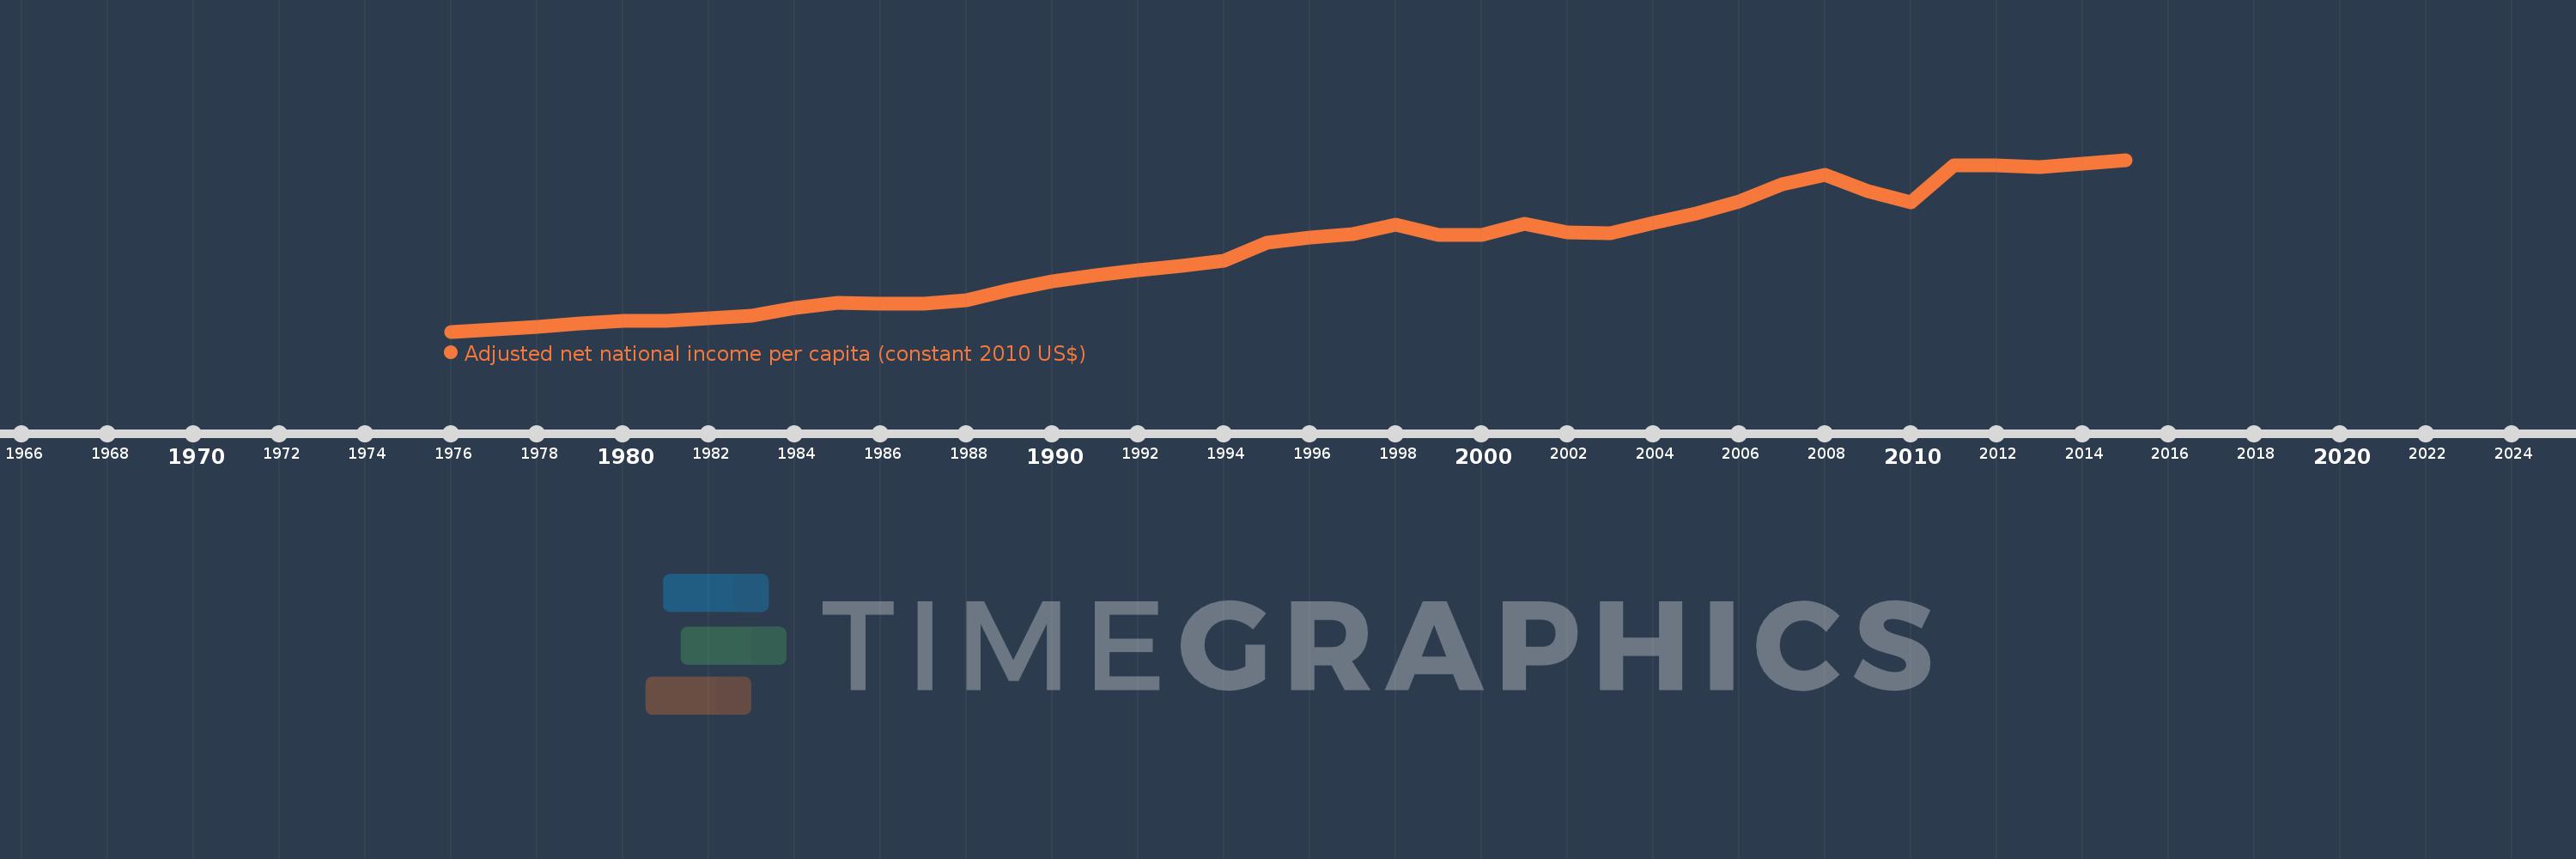
Adjusted net national income per capita (constant 2010 US$)
2015,2014,2013,2012,2011,2010,2009,2008,2007,2006,2005,2004,2003,2002,2001,2000,1999,1998,1997,1996,1995,1994,1993,1992,1991,1990,1989,1988,1987,1986,1985,1984,1983,1982,1981,1980,1979,1978,1977,1976
Queste statistiche in altri paesi:
AfghanistanAlbaniaAlgeriaAngolaArab WorldArgentinaArmeniaAustraliaAustriaAzerbaijanBahamas, TheBahrainBangladeshBarbadosBelarusBelgiumBelizeBeninBhutanBoliviaBotswanaBrazilBulgariaBurkina FasoBurundiCabo VerdeCambodiaCameroonCanadaCaribbean small statesCentral African RepublicCentral Europe and the BalticsChadChileChinaColombiaComorosCongo, Dem. Rep.Congo, Rep.Costa RicaCote d'IvoireCroatiaCubaCyprusCzech RepublicDenmarkDominicaDominican RepublicEarly-demographic dividendEast Asia & PacificEast Asia & Pacific (excluding high income)East Asia & Pacific (IDA & IBRD countries)EcuadorEgypt, Arab Rep.El SalvadorEritreaEstoniaEthiopiaEuro areaEurope & Central AsiaEurope & Central Asia (excluding high income)Europe & Central Asia (IDA & IBRD countries)European UnionFijiFinlandFragile and conflict affected situationsFranceGabonGambia, TheGeorgiaGermanyGhanaGreeceGuatemalaGuineaGuinea-BissauGuyanaHaitiHeavily indebted poor countries (HIPC)High incomeHondurasHungaryIBRD onlyIDA & IBRD totalIDA blendIDA onlyIDA totalIndiaIndonesiaIran, Islamic Rep.IraqIrelandIsraelItalyJamaicaJapanJordanKazakhstanKenyaKiribatiKorea, Rep.KuwaitKyrgyz RepublicLao PDRLate-demographic dividendLatin America & Caribbean Latin America & Caribbean (excluding high income)Latin America & the Caribbean (IDA & IBRD countries)LatviaLeast developed countries: UN classificationLebanonLesothoLiberiaLibyaLithuaniaLow & middle incomeLow incomeLower middle incomeLuxembourgMacedonia, FYRMadagascarMalawiMalaysiaMaldivesMaliMauritaniaMauritiusMexicoMiddle East & North AfricaMiddle East & North Africa (excluding high income)Middle East & North Africa (IDA & IBRD countries)Middle incomeMoldovaMongoliaMoroccoMozambiqueNamibiaNepalNetherlandsNew ZealandNicaraguaNigerNigeriaNorth AmericaNorwayOECD membersOmanOther small statesPacific island small statesPakistanPanamaPapua New GuineaParaguayPeruPhilippinesPolandPortugalPost-demographic dividendPre-demographic dividendQatarRomaniaRussian FederationRwandaSamoaSao Tome and PrincipeSaudi ArabiaSenegalSeychellesSierra LeoneSingaporeSlovak RepublicSloveniaSmall statesSolomon IslandsSouth AfricaSouth AsiaSouth Asia (IDA & IBRD)SpainSri LankaSt. LuciaSt. Vincent and the GrenadinesSub-Saharan Africa Sub-Saharan Africa (excluding high income)Sub-Saharan Africa (IDA & IBRD countries)SurinameSwazilandSwedenSwitzerlandTajikistanTanzaniaThailandTogoTongaTrinidad and TobagoTunisiaTurkeyTurkmenistanUgandaUkraineUnited Arab EmiratesUnited KingdomUnited StatesUpper middle incomeUruguayUzbekistanVanuatuVenezuela, RBVietnamWorldYemen, Rep.ZambiaZimbabwe Linea del tempo:
Questa scala temporale mostra un grafico dal 1976 anno al 2015 anno. Singapore. I dati fino ad 1975 anno non disponibili. Il numero di osservazioni attuali secondo i date: 40.
La fonte (nome):
Indicatori dello sviluppo mondiale
La fonte (organizzazione):
NULWorld Bank staff estimates based on sources and methods in World Bank's "The Changing Wealth of Nations: Measuring Sustainable Development in the New Millennium" (2011).L
Categorie:
Economy & Growth
sono stati aggiornati
23 apr 2017 anni
Indicatori delle variazioni dei valori per anni
Minima:
7.898 Mille.
1 gen 1976 anni
Massimo:
41.244 Mille.
1 gen 2015 anni
Alla data di osservazione
Valore
Variazione assoluta
La variazione rispetto al valore precedente
1 gen 1976 anni
7.898 Mille.
+7.898 Mille.
0.0%
1 gen 1977 anni
8.239 Mille.
+341.196
4.32%
1 gen 1978 anni
8.844 Mille.
+605.316
7.35%
1 gen 1979 anni
9.437 Mille.
+592.607
6.7%
1 gen 1980 anni
9.904 Mille.
+467.282
4.95%
1 gen 1981 anni
9.933 Mille.
+28.978
0.29%
1 gen 1982 anni
10.51 Mille.
+577.22
5.81%
1 gen 1983 anni
11.057 Mille.
+546.244
5.2%
1 gen 1984 anni
12.41 Mille.
+1.353 Mille.
12.24%
1 gen 1985 anni
13.474 Mille.
+1.064 Mille.
8.58%
1 gen 1986 anni
13.354 Mille.
-120.284
-0.89%
1 gen 1987 anni
13.257 Mille.
-96.402
-0.72%
1 gen 1988 anni
13.994 Mille.
+736.58
5.56%
1 gen 1989 anni
16.056 Mille.
+2.062 Mille.
14.74%
1 gen 1990 anni
17.732 Mille.
+1.676 Mille.
10.44%
1 gen 1991 anni
18.856 Mille.
+1.124 Mille.
6.34%
1 gen 1992 anni
19.817 Mille.
+960.697
5.09%
1 gen 1993 anni
20.699 Mille.
+882.275
4.45%
1 gen 1994 anni
21.681 Mille.
+981.851
4.74%
1 gen 1995 anni
25.117 Mille.
+3.437 Mille.
15.85%
1 gen 1996 anni
26.216 Mille.
+1.098 Mille.
4.37%
1 gen 1997 anni
26.779 Mille.
+563.205
2.15%
1 gen 1998 anni
28.642 Mille.
+1.863 Mille.
6.96%
1 gen 1999 anni
26.708 Mille.
-1.934 Mille.
-6.75%
1 gen 2000 anni
26.667 Mille.
-41.779
-0.16%
1 gen 2001 anni
28.839 Mille.
+2.172 Mille.
8.15%
1 gen 2002 anni
27.091 Mille.
-1.748 Mille.
-6.06%
1 gen 2003 anni
26.938 Mille.
-152.281
-0.56%
1 gen 2004 anni
29.058 Mille.
+2.119 Mille.
7.87%
1 gen 2005 anni
30.802 Mille.
+1.744 Mille.
6.0%
1 gen 2006 anni
33.216 Mille.
+2.414 Mille.
7.84%
1 gen 2007 anni
36.437 Mille.
+3.222 Mille.
9.7%
1 gen 2008 anni
38.293 Mille.
+1.855 Mille.
5.09%
1 gen 2009 anni
35.15 Mille.
-3.143 Mille.
-8.21%
1 gen 2010 anni
32.942 Mille.
-2.208 Mille.
-6.28%
1 gen 2011 anni
40.241 Mille.
+7.299 Mille.
22.16%
1 gen 2012 anni
40.227 Mille.
-14.776
-0.04%
1 gen 2013 anni
39.837 Mille.
-389.165
-0.97%
1 gen 2014 anni
40.436 Mille.
+598.234
1.5%
1 gen 2015 anni
41.244 Mille.
+808.634
2.0%
Classificazione dei paesi secondo i statistiche attuali per anni


Commenti: