29
/it/
it
AIzaSyAYiBZKx7MnpbEhh9jyipgxe19OcubqV5w
April 1, 2024
155530
Indonesia
IDN
true
2
1
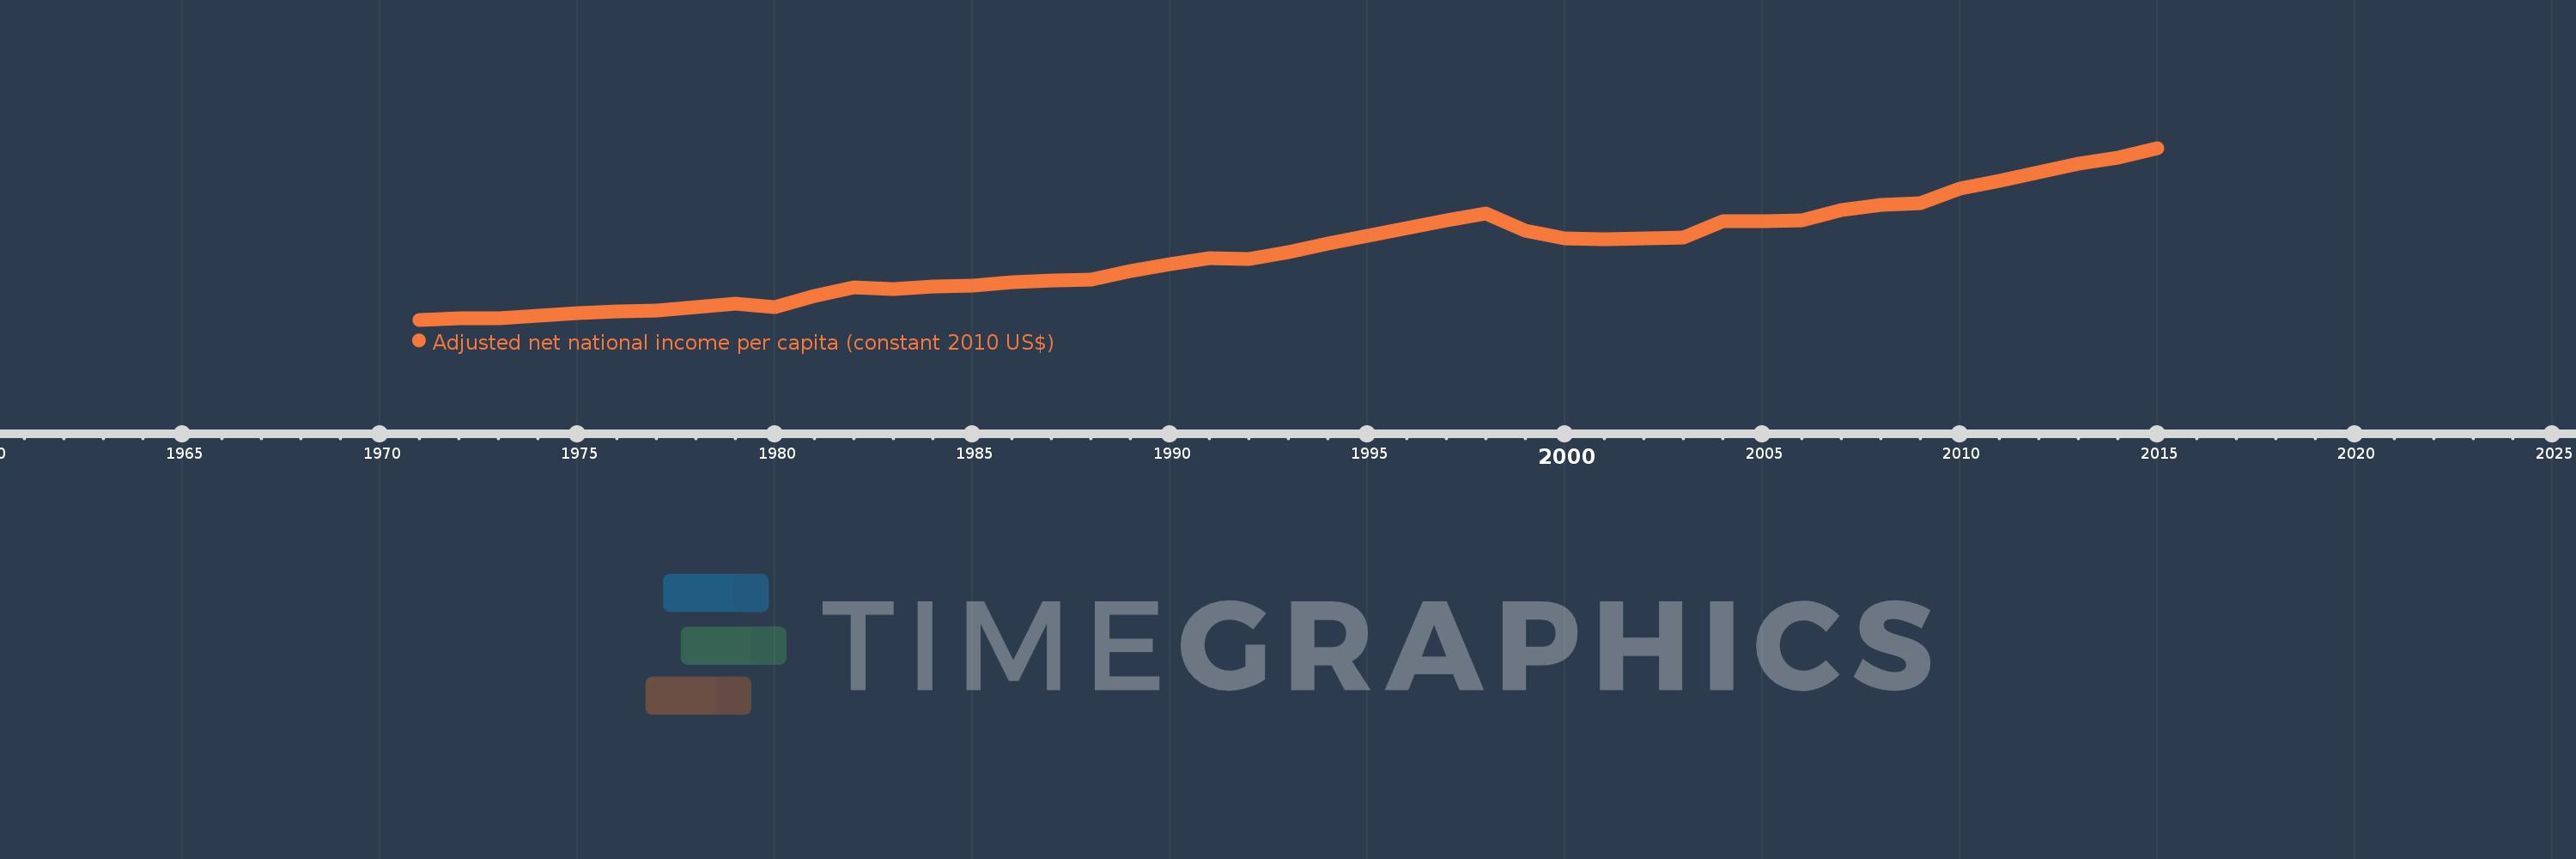
Adjusted net national income per capita (constant 2010 US$)
2015,2014,2013,2012,2011,2010,2009,2008,2007,2006,2005,2004,2003,2002,2001,2000,1999,1998,1997,1996,1995,1994,1993,1992,1991,1990,1989,1988,1987,1986,1985,1984,1983,1982,1981,1980,1979,1978,1977,1976,1975,1974,1973,1972,1971
Queste statistiche in altri paesi:
AfghanistanAlbaniaAlgeriaAngolaArab WorldArgentinaArmeniaAustraliaAustriaAzerbaijanBahamas, TheBahrainBangladeshBarbadosBelarusBelgiumBelizeBeninBhutanBoliviaBotswanaBrazilBulgariaBurkina FasoBurundiCabo VerdeCambodiaCameroonCanadaCaribbean small statesCentral African RepublicCentral Europe and the BalticsChadChileChinaColombiaComorosCongo, Dem. Rep.Congo, Rep.Costa RicaCote d'IvoireCroatiaCubaCyprusCzech RepublicDenmarkDominicaDominican RepublicEarly-demographic dividendEast Asia & PacificEast Asia & Pacific (excluding high income)East Asia & Pacific (IDA & IBRD countries)EcuadorEgypt, Arab Rep.El SalvadorEritreaEstoniaEthiopiaEuro areaEurope & Central AsiaEurope & Central Asia (excluding high income)Europe & Central Asia (IDA & IBRD countries)European UnionFijiFinlandFragile and conflict affected situationsFranceGabonGambia, TheGeorgiaGermanyGhanaGreeceGuatemalaGuineaGuinea-BissauGuyanaHaitiHeavily indebted poor countries (HIPC)High incomeHondurasHungaryIBRD onlyIDA & IBRD totalIDA blendIDA onlyIDA totalIndiaIndonesiaIran, Islamic Rep.IraqIrelandIsraelItalyJamaicaJapanJordanKazakhstanKenyaKiribatiKorea, Rep.KuwaitKyrgyz RepublicLao PDRLate-demographic dividendLatin America & Caribbean Latin America & Caribbean (excluding high income)Latin America & the Caribbean (IDA & IBRD countries)LatviaLeast developed countries: UN classificationLebanonLesothoLiberiaLibyaLithuaniaLow & middle incomeLow incomeLower middle incomeLuxembourgMacedonia, FYRMadagascarMalawiMalaysiaMaldivesMaliMauritaniaMauritiusMexicoMiddle East & North AfricaMiddle East & North Africa (excluding high income)Middle East & North Africa (IDA & IBRD countries)Middle incomeMoldovaMongoliaMoroccoMozambiqueNamibiaNepalNetherlandsNew ZealandNicaraguaNigerNigeriaNorth AmericaNorwayOECD membersOmanOther small statesPacific island small statesPakistanPanamaPapua New GuineaParaguayPeruPhilippinesPolandPortugalPost-demographic dividendPre-demographic dividendQatarRomaniaRussian FederationRwandaSamoaSao Tome and PrincipeSaudi ArabiaSenegalSeychellesSierra LeoneSingaporeSlovak RepublicSloveniaSmall statesSolomon IslandsSouth AfricaSouth AsiaSouth Asia (IDA & IBRD)SpainSri LankaSt. LuciaSt. Vincent and the GrenadinesSub-Saharan Africa Sub-Saharan Africa (excluding high income)Sub-Saharan Africa (IDA & IBRD countries)SurinameSwazilandSwedenSwitzerlandTajikistanTanzaniaThailandTogoTongaTrinidad and TobagoTunisiaTurkeyTurkmenistanUgandaUkraineUnited Arab EmiratesUnited KingdomUnited StatesUpper middle incomeUruguayUzbekistanVanuatuVenezuela, RBVietnamWorldYemen, Rep.ZambiaZimbabwe Linea del tempo:
Questa scala temporale mostra un grafico dal 1971 anno al 2015 anno. Indonesia. I dati fino ad 1970 anno non disponibili. Il numero di osservazioni attuali secondo i date: 45.
La fonte (nome):
Indicatori dello sviluppo mondiale
La fonte (organizzazione):
NULWorld Bank staff estimates based on sources and methods in World Bank's "The Changing Wealth of Nations: Measuring Sustainable Development in the New Millennium" (2011).L
Categorie:
Economy & Growth
sono stati aggiornati
23 apr 2017 anni
Indicatori delle variazioni dei valori per anni
Minima:
526.532
1 gen 1971 anni
Massimo:
3.255 Mille.
1 gen 2015 anni
Alla data di osservazione
Valore
Variazione assoluta
La variazione rispetto al valore precedente
1 gen 1971 anni
526.532
+526.532
0.0%
1 gen 1972 anni
545.418
+18.886
3.59%
1 gen 1973 anni
556.464
+11.046
2.03%
1 gen 1974 anni
588.845
+32.381
5.82%
1 gen 1975 anni
631.517
+42.672
7.25%
1 gen 1976 anni
662.922
+31.405
4.97%
1 gen 1977 anni
675.757
+12.835
1.94%
1 gen 1978 anni
721.219
+45.462
6.73%
1 gen 1979 anni
782.004
+60.785
8.43%
1 gen 1980 anni
727.266
-54.738
-7.0%
1 gen 1981 anni
902.821
+175.555
24.14%
1 gen 1982 anni
1.038 Mille.
+135.141
14.97%
1 gen 1983 anni
1.015 Mille.
-22.711
-2.19%
1 gen 1984 anni
1.059 Mille.
+44.046
4.34%
1 gen 1985 anni
1.073 Mille.
+13.758
1.3%
1 gen 1986 anni
1.122 Mille.
+49.126
4.58%
1 gen 1987 anni
1.151 Mille.
+28.688
2.56%
1 gen 1988 anni
1.16 Mille.
+8.883
0.77%
1 gen 1989 anni
1.294 Mille.
+134.316
11.58%
1 gen 1990 anni
1.403 Mille.
+108.464
8.38%
1 gen 1991 anni
1.501 Mille.
+98.849
7.05%
1 gen 1992 anni
1.487 Mille.
-13.949
-0.93%
1 gen 1993 anni
1.598 Mille.
+111.016
7.46%
1 gen 1994 anni
1.733 Mille.
+134.79
8.43%
1 gen 1995 anni
1.863 Mille.
+129.617
7.48%
1 gen 1996 anni
1.981 Mille.
+118.192
6.34%
1 gen 1997 anni
2.106 Mille.
+124.719
6.3%
1 gen 1998 anni
2.213 Mille.
+107.716
5.12%
1 gen 1999 anni
1.937 Mille.
-276.121
-12.47%
1 gen 2000 anni
1.822 Mille.
-115.659
-5.97%
1 gen 2001 anni
1.808 Mille.
-14.147
-0.78%
1 gen 2002 anni
1.814 Mille.
+6.459
0.36%
1 gen 2003 anni
1.834 Mille.
+19.585
1.08%
1 gen 2004 anni
2.085 Mille.
+251.175
13.7%
1 gen 2005 anni
2.097 Mille.
+11.752
0.56%
1 gen 2006 anni
2.103 Mille.
+6.615
0.32%
1 gen 2007 anni
2.263 Mille.
+159.85
7.6%
1 gen 2008 anni
2.353 Mille.
+89.907
3.97%
1 gen 2009 anni
2.378 Mille.
+24.656
1.05%
1 gen 2010 anni
2.607 Mille.
+229.558
9.66%
1 gen 2011 anni
2.738 Mille.
+131.165
5.03%
1 gen 2012 anni
2.863 Mille.
+125.089
4.57%
1 gen 2013 anni
3.001 Mille.
+137.994
4.82%
1 gen 2014 anni
3.097 Mille.
+95.89
3.19%
1 gen 2015 anni
3.255 Mille.
+157.429
5.08%
Classificazione dei paesi secondo i statistiche attuali per anni


Commenti: