29
/it/
it
AIzaSyAYiBZKx7MnpbEhh9jyipgxe19OcubqV5w
April 1, 2024
234279
Sao Tome and Principe
STP
true
2
1
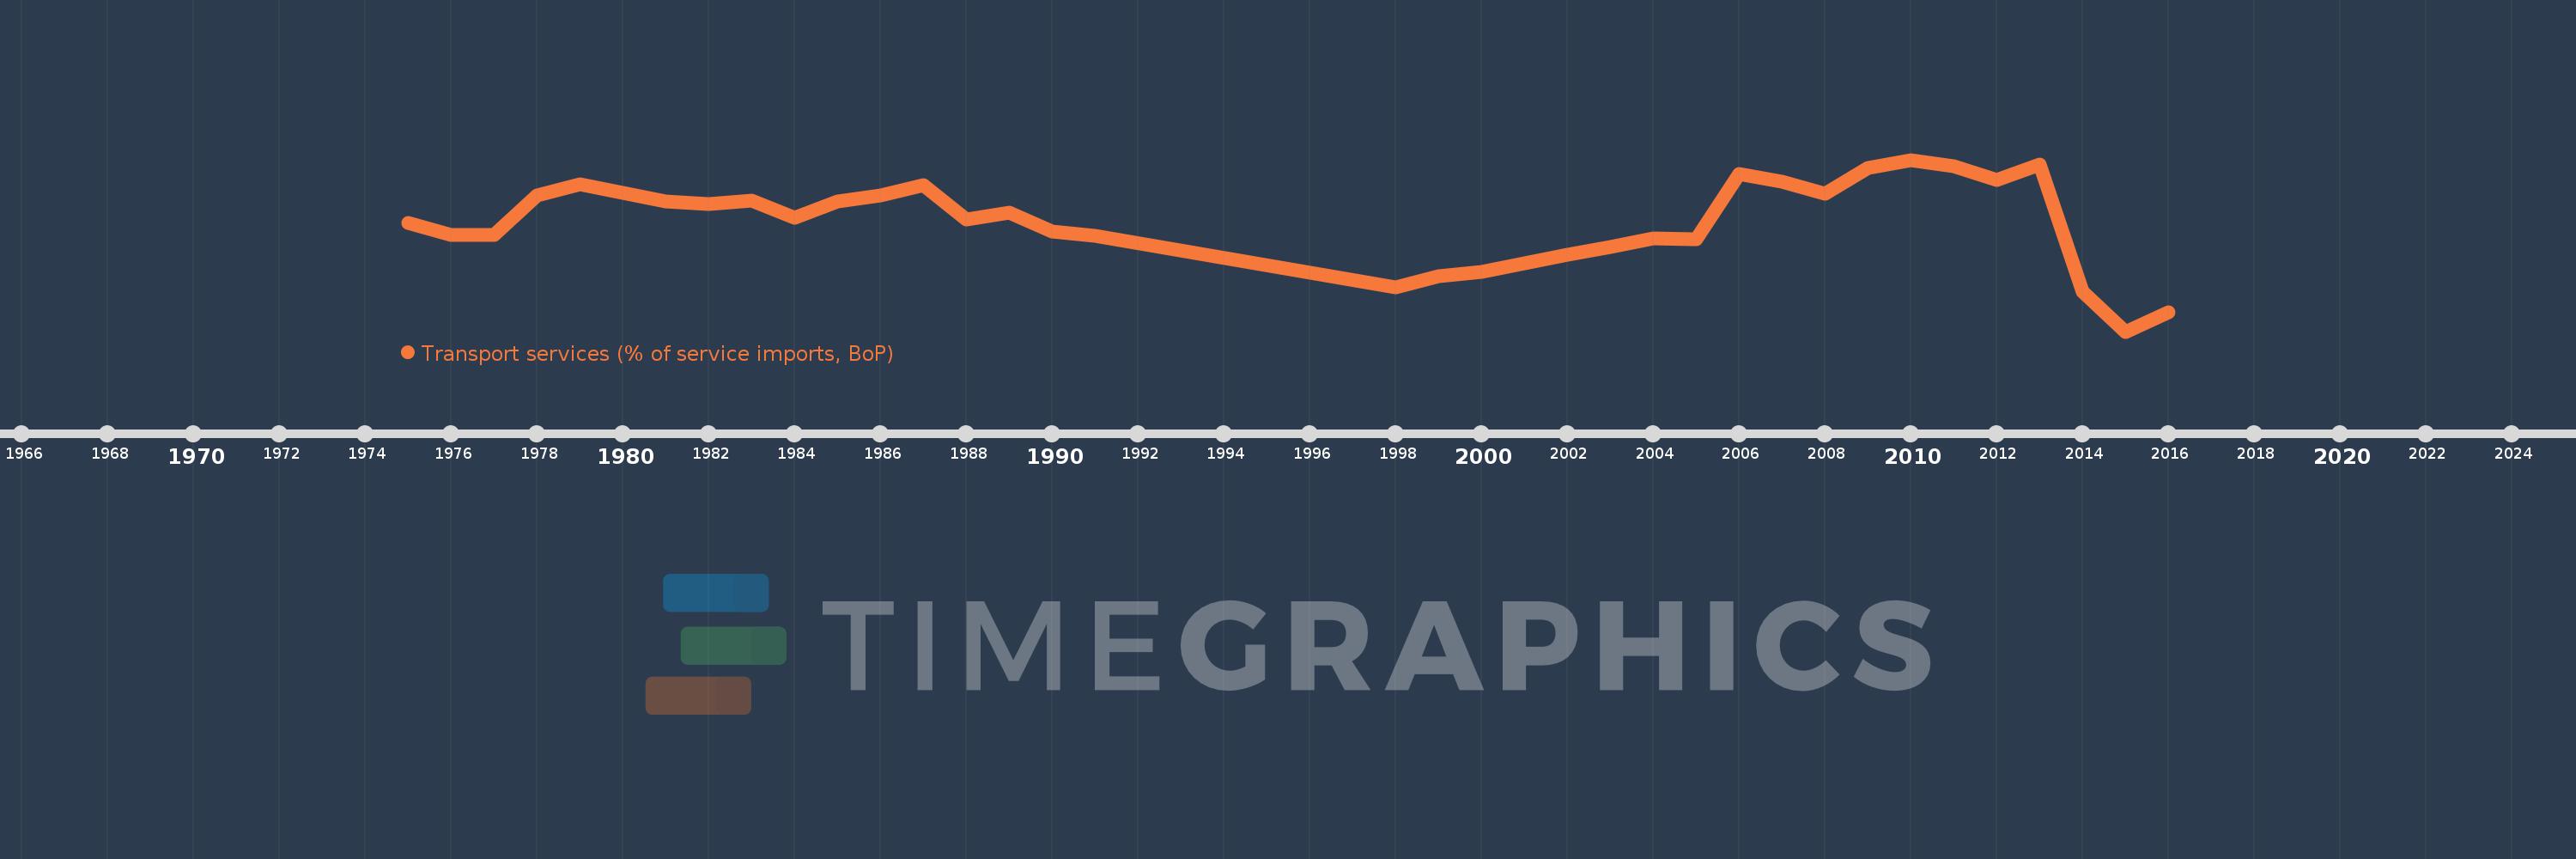
Transport services (% of service imports, BoP)
2016,2015,2014,2013,2012,2011,2010,2009,2008,2007,2006,2005,2004,2003,2002,2001,2000,1999,1998,1991,1990,1989,1988,1987,1986,1985,1984,1983,1982,1981,1980,1979,1978,1977,1976,1975
Queste statistiche in altri paesi:
AfghanistanAlbaniaAlgeriaAngolaAntigua and BarbudaArab WorldArgentinaArmeniaArubaAustraliaAustriaAzerbaijanBahamas, TheBahrainBangladeshBarbadosBelarusBelgiumBelizeBeninBermudaBhutanBoliviaBosnia and HerzegovinaBotswanaBrazilBrunei DarussalamBulgariaBurkina FasoBurundiCabo VerdeCambodiaCameroonCanadaCaribbean small statesCentral African RepublicCentral Europe and the BalticsChadChileChinaColombiaComorosCongo, Dem. Rep.Congo, Rep.Costa RicaCote d'IvoireCroatiaCuracaoCyprusCzech RepublicDenmarkDjiboutiDominicaDominican RepublicEarly-demographic dividendEast Asia & PacificEast Asia & Pacific (excluding high income)East Asia & Pacific (IDA & IBRD countries)EcuadorEgypt, Arab Rep.El SalvadorEquatorial GuineaEritreaEstoniaEthiopiaEuro areaEurope & Central AsiaEurope & Central Asia (excluding high income)Europe & Central Asia (IDA & IBRD countries)European UnionFaroe IslandsFijiFinlandFragile and conflict affected situationsFranceFrench PolynesiaGabonGambia, TheGeorgiaGermanyGhanaGreeceGrenadaGuatemalaGuineaGuinea-BissauGuyanaHaitiHeavily indebted poor countries (HIPC)High incomeHondurasHong Kong SAR, ChinaHungaryIBRD onlyIcelandIDA & IBRD totalIDA onlyIDA totalIndiaIndonesiaIran, Islamic Rep.IraqIrelandIsraelItalyJamaicaJapanJordanKazakhstanKenyaKiribatiKorea, Rep.KosovoKuwaitKyrgyz RepublicLao PDRLate-demographic dividendLatin America & Caribbean Latin America & Caribbean (excluding high income)Latin America & the Caribbean (IDA & IBRD countries)LatviaLeast developed countries: UN classificationLebanonLesothoLiberiaLibyaLithuaniaLow & middle incomeLow incomeLower middle incomeLuxembourgMacao SAR, ChinaMacedonia, FYRMadagascarMalawiMalaysiaMaldivesMaliMaltaMarshall IslandsMauritaniaMauritiusMexicoMicronesia, Fed. Sts.Middle East & North AfricaMiddle East & North Africa (excluding high income)Middle East & North Africa (IDA & IBRD countries)Middle incomeMoldovaMongoliaMontenegroMoroccoMozambiqueMyanmarNamibiaNepalNetherlandsNew CaledoniaNew ZealandNicaraguaNigerNigeriaNorth AmericaNorwayOECD membersOmanOther small statesPacific island small statesPakistanPalauPanamaPapua New GuineaParaguayPeruPhilippinesPolandPortugalPost-demographic dividendPre-demographic dividendQatarRomaniaRussian FederationRwandaSamoaSao Tome and PrincipeSaudi ArabiaSenegalSerbiaSeychellesSierra LeoneSingaporeSint Maarten (Dutch part)Slovak RepublicSloveniaSmall statesSolomon IslandsSouth AfricaSouth AsiaSouth Asia (IDA & IBRD)South SudanSpainSri LankaSt. Kitts and NevisSt. LuciaSt. Vincent and the GrenadinesSub-Saharan Africa Sub-Saharan Africa (excluding high income)Sub-Saharan Africa (IDA & IBRD countries)SudanSurinameSwazilandSwedenSwitzerlandSyrian Arab RepublicTajikistanTanzaniaThailandTimor-LesteTogoTongaTrinidad and TobagoTunisiaTurkeyTuvaluUgandaUkraineUnited KingdomUnited StatesUpper middle incomeUruguayVanuatuVenezuela, RBWest Bank and GazaWorldYemen, Rep.ZambiaZimbabwe Linea del tempo:
Questa scala temporale mostra un grafico dal 1975 anno al 2016 anno. Sao Tome and Principe. I dati fino ad 1974 anno non disponibili. Il numero di osservazioni attuali secondo i date: 36.
La fonte (nome):
Indicatori dello sviluppo mondiale
La fonte (organizzazione):
International Monetary Fund, Balance of Payments Statistics Yearbook and data files.
Categorie:
Economy & Growth, Trade
sono stati aggiornati
23 apr 2017 anni
Indicatori delle variazioni dei valori per anni
Minima:
30.828
1 gen 2015 anni
Massimo:
83.154
1 gen 2010 anni
Alla data di osservazione
Valore
Variazione assoluta
La variazione rispetto al valore precedente
1 gen 1975 anni
63.932
+63.932
0.0%
1 gen 1976 anni
60.27
-3.662
-5.73%
1 gen 1977 anni
60.296
+0.026
0.04%
1 gen 1978 anni
72.167
+11.871
19.69%
1 gen 1979 anni
75.791
+3.624
5.02%
1 gen 1980 anni
73.181
-2.609
-3.44%
1 gen 1981 anni
70.344
-2.837
-3.88%
1 gen 1982 anni
69.785
-0.559
-0.8%
1 gen 1983 anni
70.598
+0.813
1.16%
1 gen 1984 anni
65.436
-5.162
-7.31%
1 gen 1985 anni
70.567
+5.131
7.84%
1 gen 1986 anni
72.413
+1.847
2.62%
1 gen 1987 anni
75.508
+3.095
4.27%
1 gen 1988 anni
64.923
-10.586
-14.02%
1 gen 1989 anni
66.952
+2.03
3.13%
1 gen 1990 anni
61.435
-5.517
-8.24%
1 gen 1991 anni
60.122
-1.313
-2.14%
1 gen 1998 anni
44.249
-15.873
-26.4%
1 gen 1999 anni
47.703
+3.454
7.81%
1 gen 2000 anni
48.944
+1.241
2.6%
1 gen 2001 anni
51.677
+2.733
5.58%
1 gen 2002 anni
54.169
+2.492
4.82%
1 gen 2003 anni
56.638
+2.469
4.56%
1 gen 2004 anni
59.136
+2.499
4.41%
1 gen 2005 anni
58.977
-0.159
-0.27%
1 gen 2006 anni
78.827
+19.849
33.66%
1 gen 2007 anni
76.543
-2.283
-2.9%
1 gen 2008 anni
72.906
-3.638
-4.75%
1 gen 2009 anni
80.686
+7.781
10.67%
1 gen 2010 anni
83.154
+2.467
3.06%
1 gen 2011 anni
81.139
-2.014
-2.42%
1 gen 2012 anni
76.965
-4.175
-5.14%
1 gen 2013 anni
81.637
+4.672
6.07%
1 gen 2014 anni
42.898
-38.738
-47.45%
1 gen 2015 anni
30.828
-12.07
-28.14%
1 gen 2016 anni
36.675
+5.847
18.97%
Classificazione dei paesi secondo i statistiche attuali per anni


Commenti: